Related Articles

Bitcoin oscillates with a downside, almost teetering on a $105,000 precipice, having just sidestepped a catastrophic downfall near $104,200. The daily charts show a coiled spring in the making–a corrective flag formation. But the good thing: the bigger picture is still bullish, encapsulated by key Fibonacci levels on higher timeframes. Is this just a break before the next big surge, or is it a sign indicating a scarring deeper correction?
What’s Happening With Bitcoin’s Price?
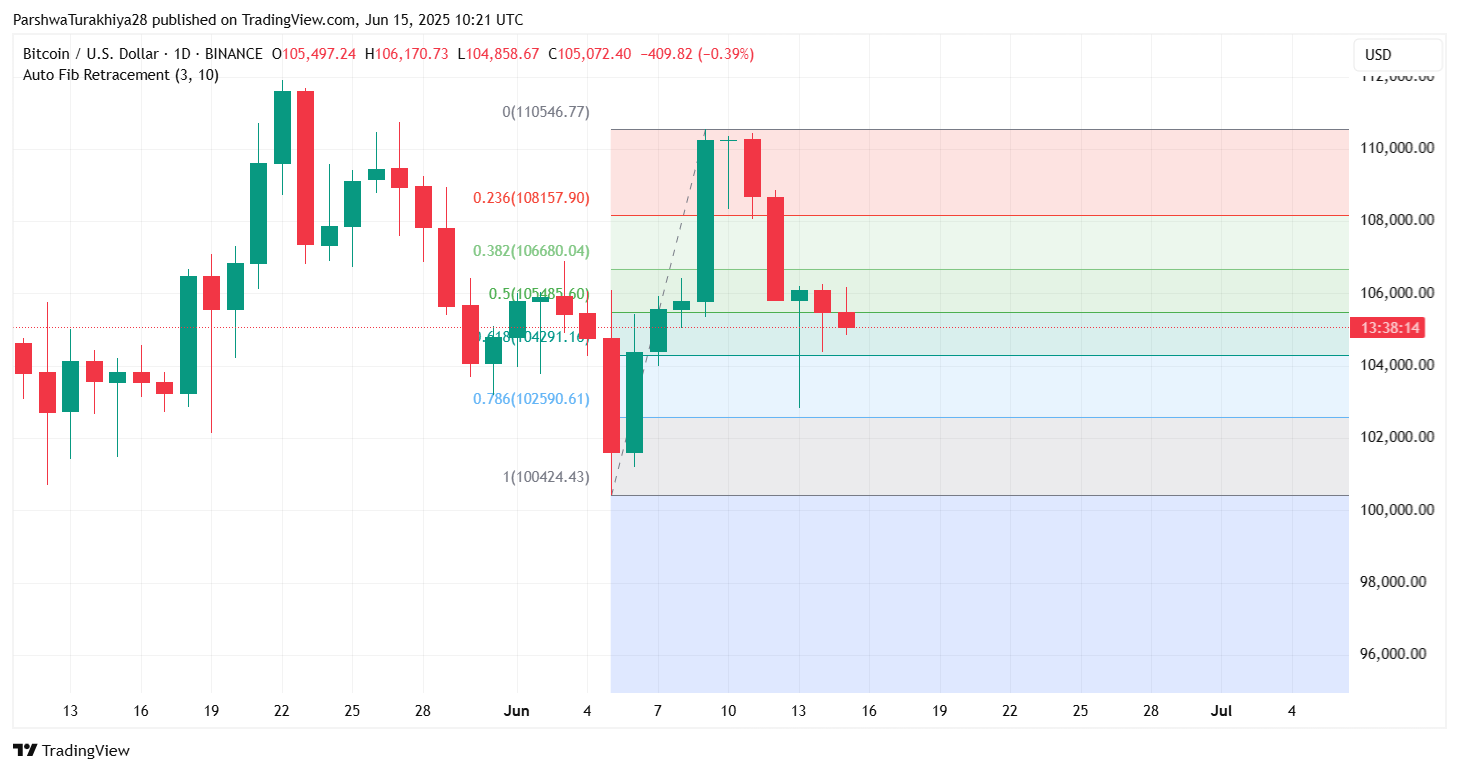
BTC price dynamics (Source: TradingView)
Bitcoin has been tantalizingly on hold ever since the stock touched and fell below $106,000 on June 13. Picture a coiled spring as BTC, stuck between a ceiling at $106,000 and a floor at $104,000. The daily chart shows Bitcoin hanging off precariously on the 0.5 Fibonacci retracement line at $105,485 as it tries to build a launchpad above $104,291 (0.618 Fibonacci zone). The market is screaming “maybe” with the candles of the recent session having indicated extreme indecision. Will it escape or will it bounce?
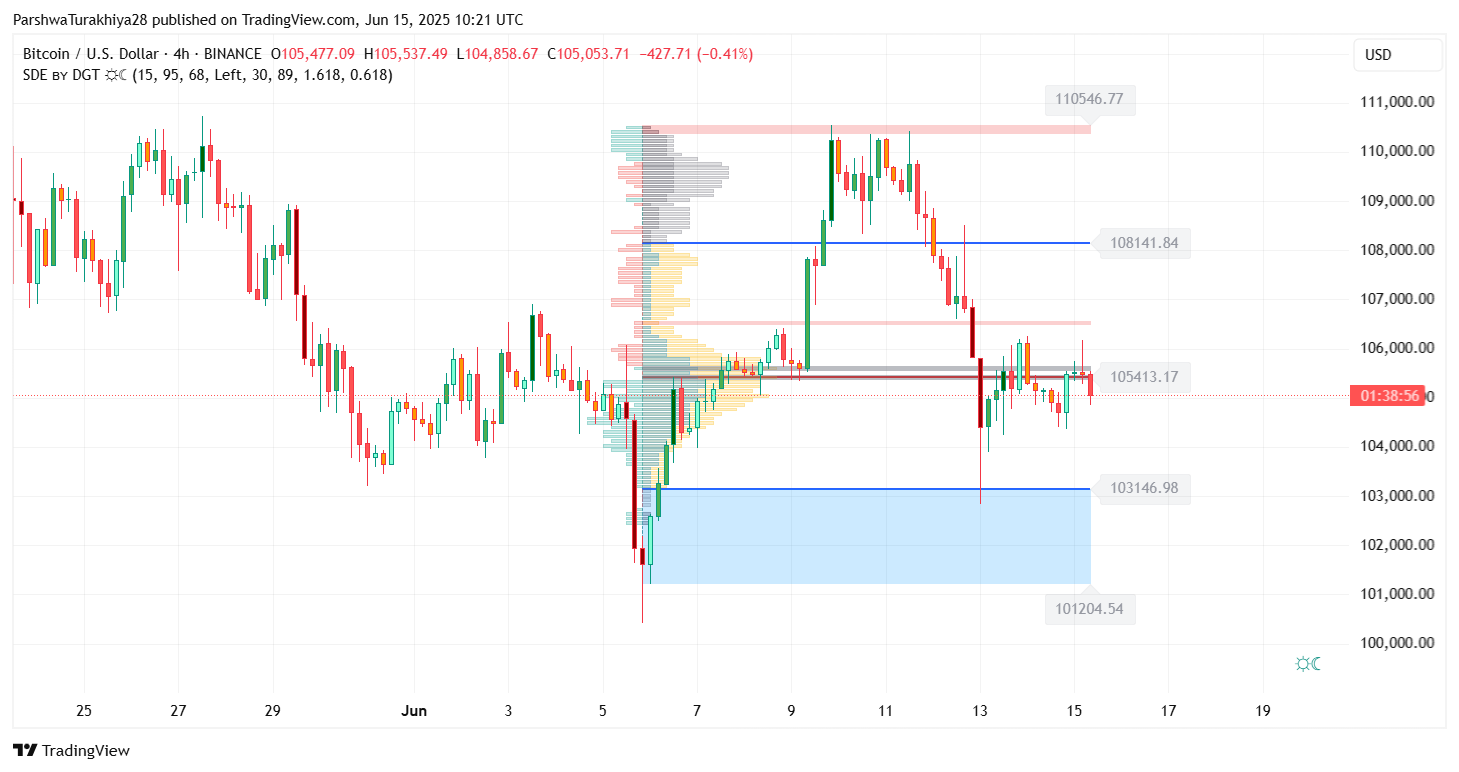
BTC price dynamics (Source: TradingView)
Bitcoin’s 4-hour chart is something of a high wires act. The micro-channel formed here has bullish eyes glued on the $103,150 of support, while the bears stay glued to the $105,400 ceiling. But where does the real battle belong? Volume profiles are screaming that $104,200-$105,800 might have become the high-stakes battleground for the week-long wrestling. Expect fireworks if this price range breaks away.
Bitcoin Price Action Faces Resistance From Cloud and EMA Cluster
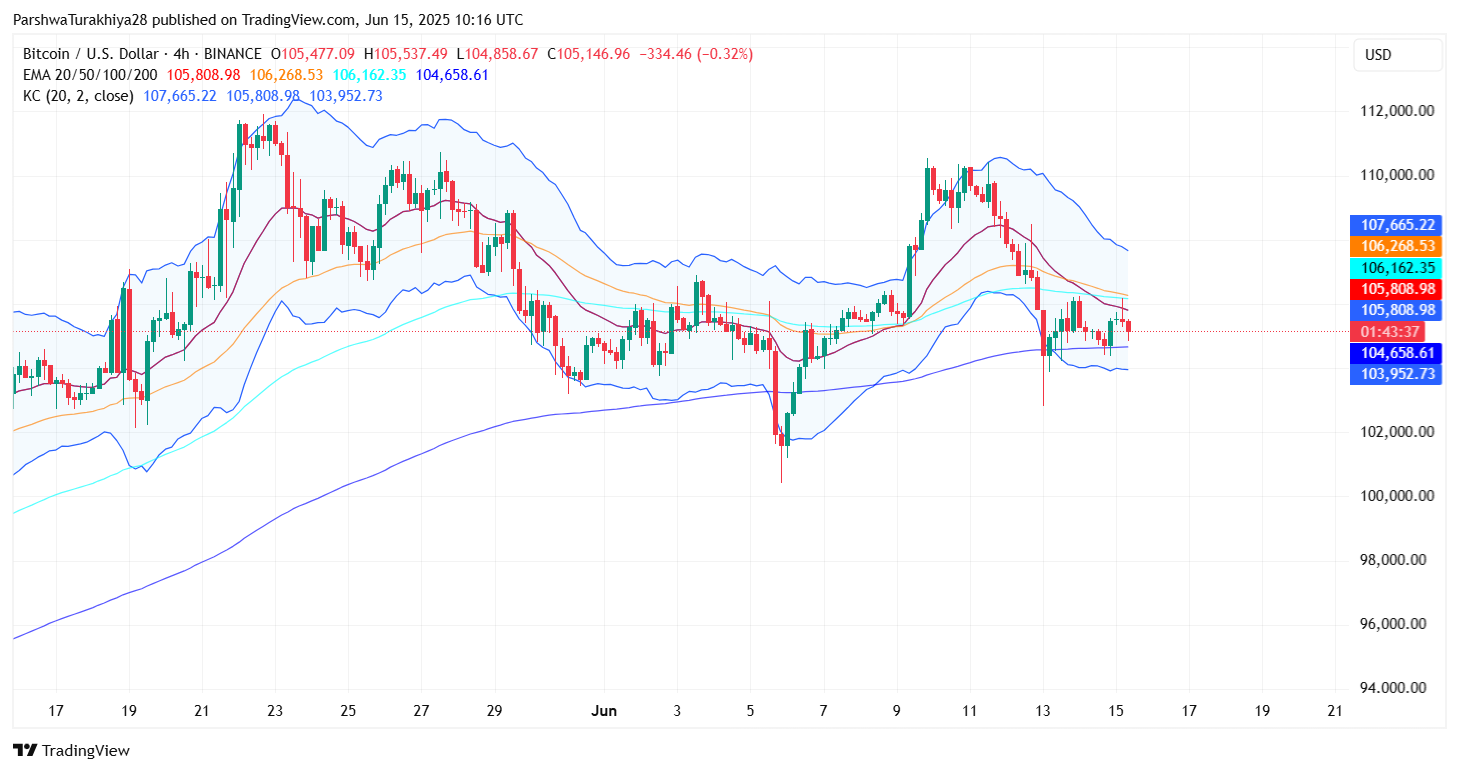
BTC price dynamics (Source: TradingView)
Bitcoin is going against the triple threat on the 4-hour chart. An entire cluster of attempted EMAs (20, 50, and 100) along with the midline of the Keltner Channel squeeze the price down. To add, from $105,800 to $106,300, sellers await. The flat Tenkan-Sen and Kijun-Sen line of the Ichimoku Cloud reinforce this area, turning it into a strong defense for buyers.
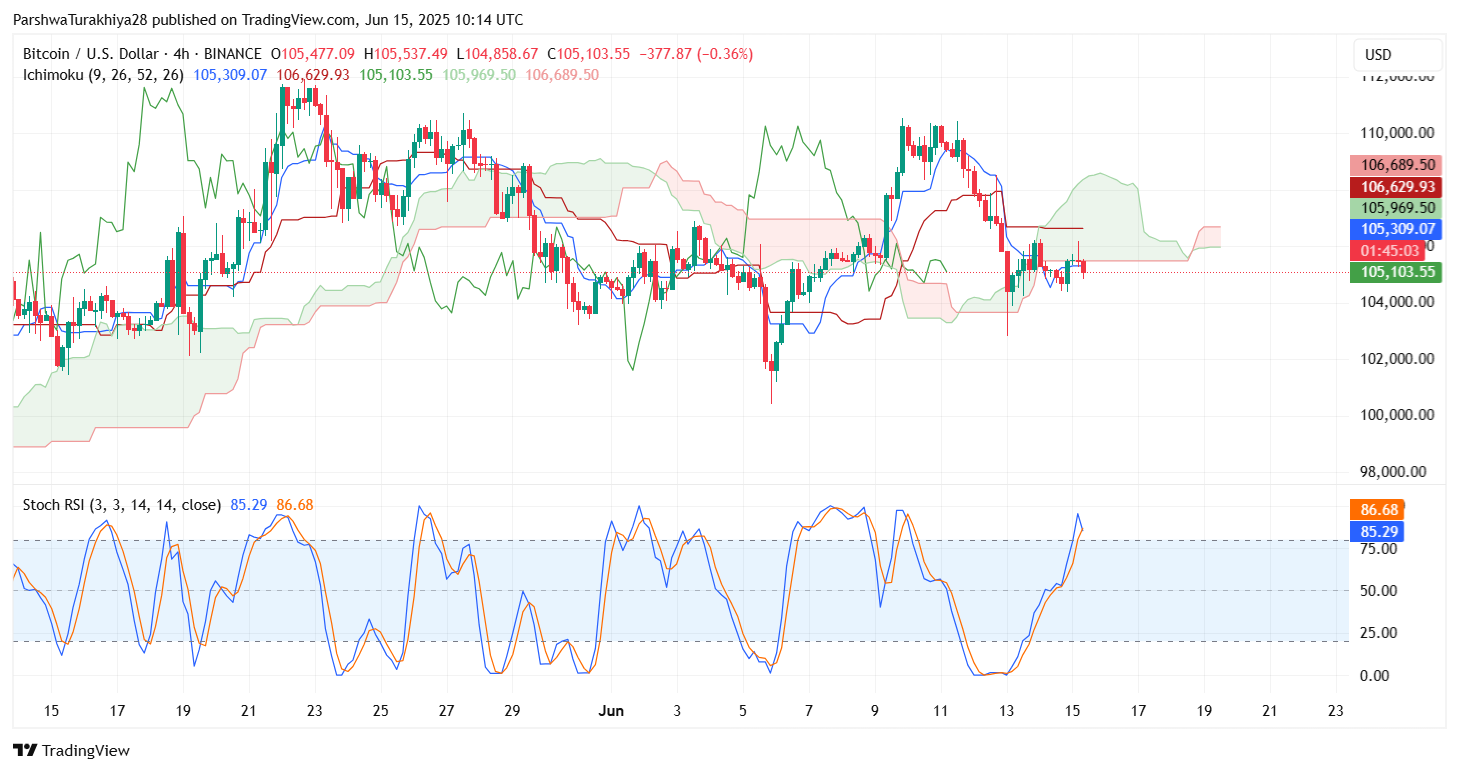
BTC price dynamics (Source: TradingView)
Bitcoin’s Stochastic RSI suits danger, teetering near overbought levels (85-86) – an alarm that exhaustion is at hand. But hold your champagne! Unless Bitcoin can wrest that $106,300 level back into its domain, this rally might just prove to be a sojourning mirage in the crypto desert.
Bitcoin’s coiled spring is building momentum as the Bollinger bands begin to squeeze and draw a violent price breakout. Prepare for impact- either an explosive breakout or a bone-crushing breakdown. The calm is going to end one way or the other.
Why is the Bitcoin Price Going Down Today?
BTC price dynamics (Source: TradingView)
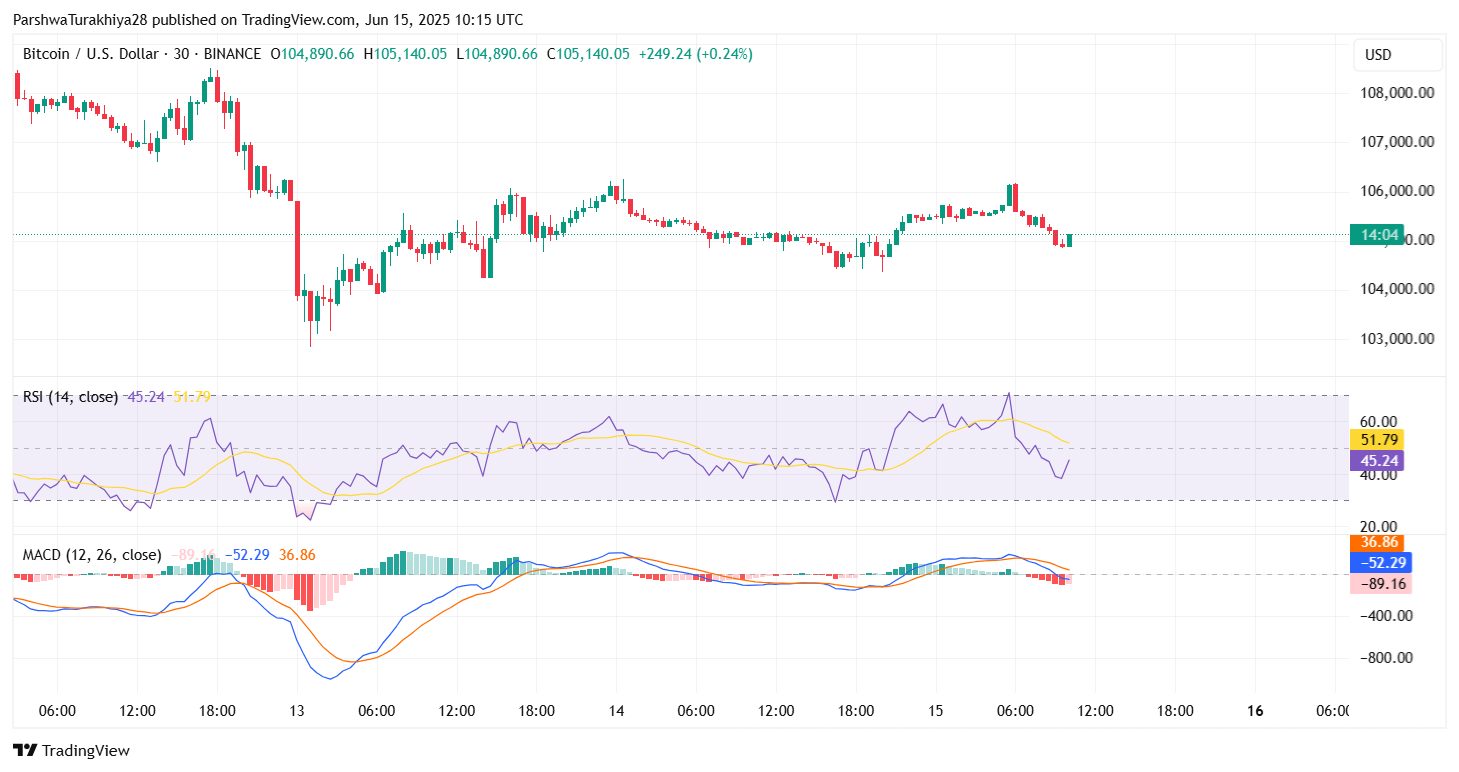
Bitcoin Wobbles: Can Bulls Break the $106,000 Ceiling?
The price of Bitcoin is carefully trading today as if caught between overhead resistance and subdued buying effort. Resistance at $105,800 remains stubborn enough to resist more attempts, while any bids above $106,000 cannot seem to gain a foothold. A quick look at the 30-minute MACD shows a bearish degradation while the RSI drops from the 52-53 range down to 45, indicating a potential pullback. Is this just a temporary pullback ahead of another assault on resistance, or the beginning of a deeper correction?
BTC price dynamics (Source: TradingView)
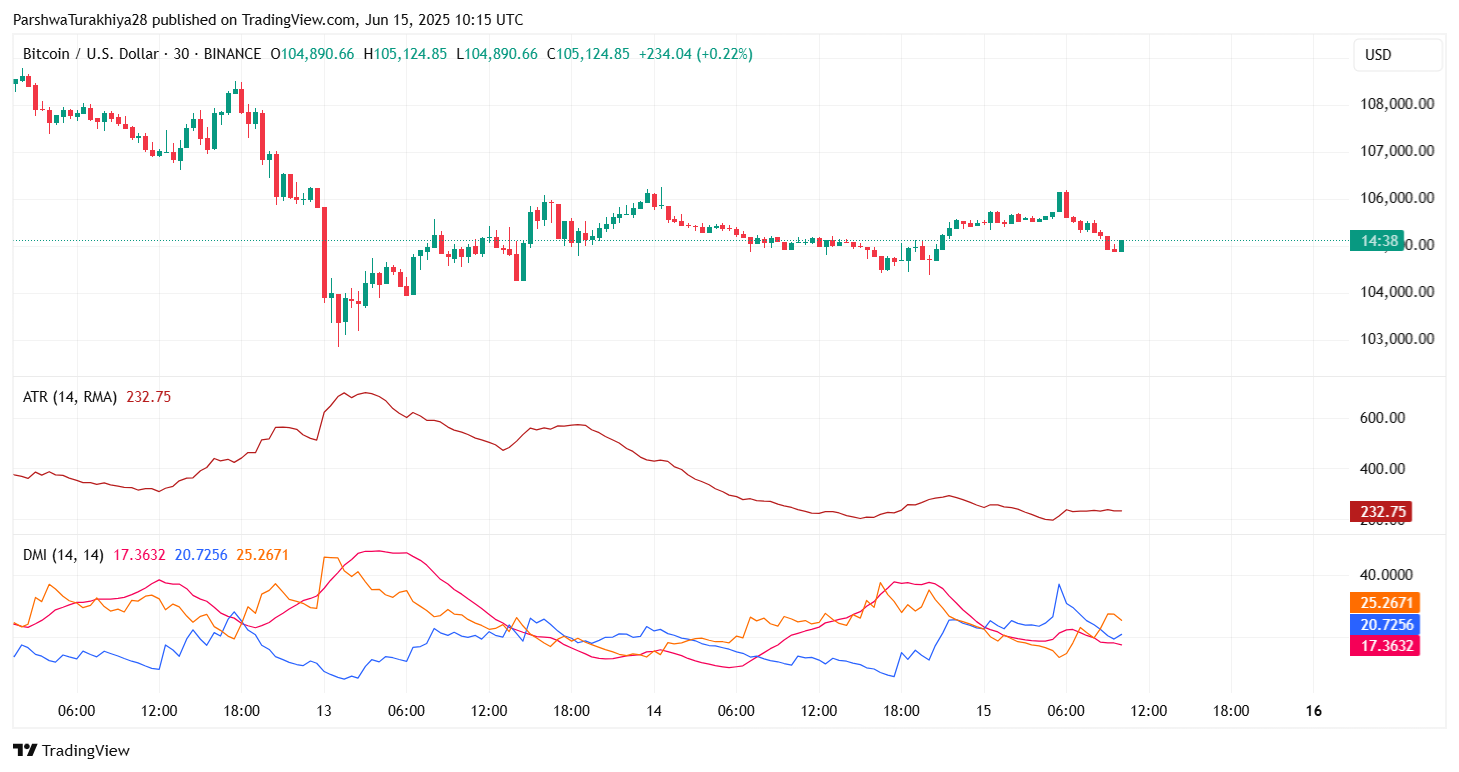
What an indecisive 30-minute time frame for Bitcoin! Looking at the DMI, it seems like a soft murmur rather than a loud shout in favor of the trend hanging by a sheer thread. The +DI and -DI locked in a chaotic dance suggest a market that is struggling to pick directions. The ADX is stubbornly less than 25, indicating that there is no conviction. And those tempting spikes in Bitcoin’s price are now met swiftly by selling pressure, making traders jittery as the weekend looms.
BTC is in limbo between life and death. Therefore, must it attempt the $106k barrier within the coming 12-24 hours? If it fails to stay above that level, then it may have to fall back to the $103-$104K level. The time is ticking.
Short-Term Outlook: Can BTC Retest $107K or Slide Toward $102K?
BTC price dynamics (Source: TradingView)
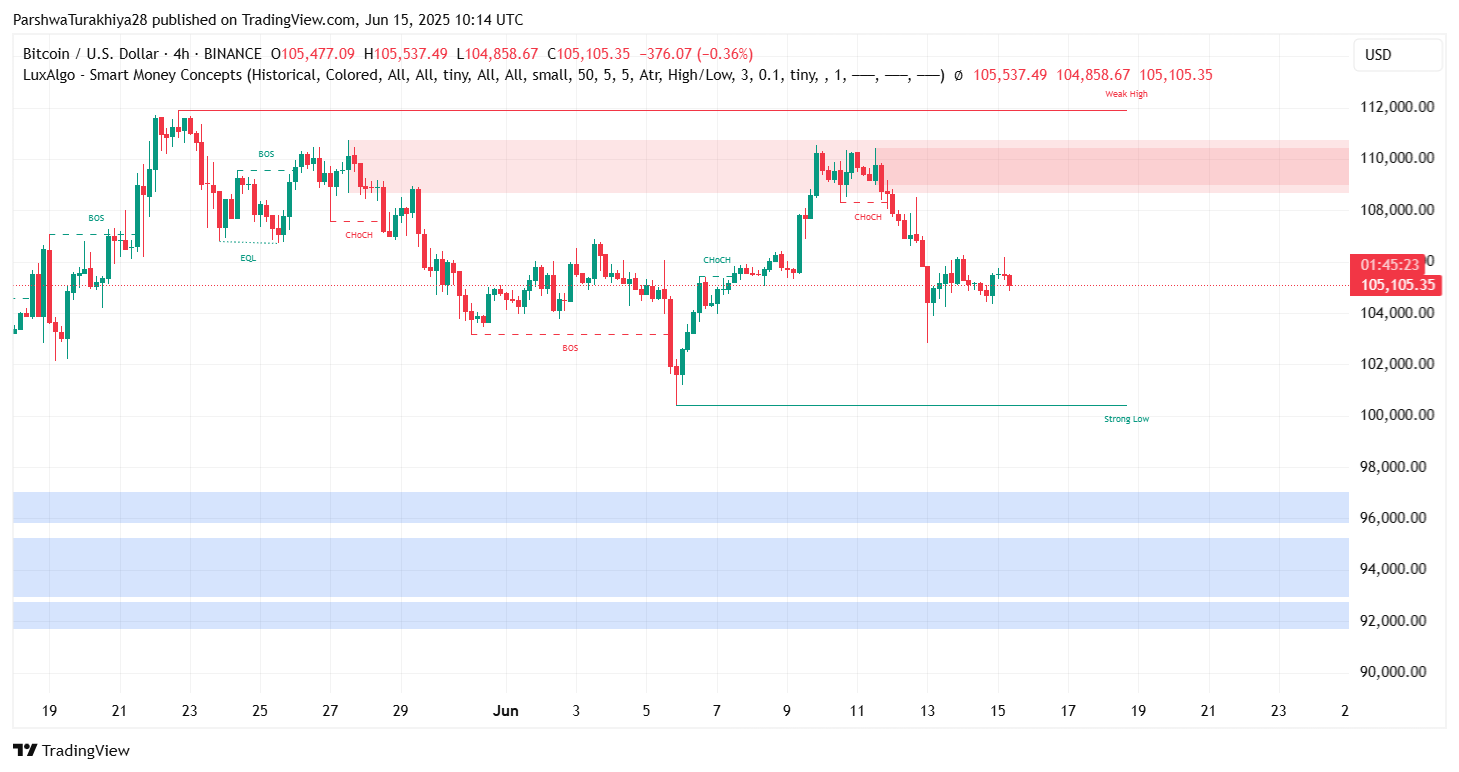
BTC teeters on the edge of the symmetrical triangle, essentially a coiled spring uncompressed and waiting to snap. All eyes are on the $105,400 mark, being eyed as the launch pad. Will bulls find it in their capacity to manage the breakout? A swift move above this level on heavy volume will surely kindle higher rally to $107,000. Further above stands an impending test as $108,150, a key Fibonacci level on the daily chart. The anticipation stage is now!
“Hold on! Prices might trend to $103,150 once they break below $104,200, whereas the freefall can happen toward $101,200. This level is a tested area for the counters and actually ripe for a rebound in case it gets visited”.
Bitcoin is holding the high ground. The $100,400 level is the line in the sand. It breached that high once, now it has become bedrock with the bulls anchored on it unless there is a seismic shift in market sentiment that sends shockwaves through the crypto landscape.
Bitcoin Forecast Table: June 16 2025
| Indicator | Value / Signal |
| Bitcoin price today | $105,140 |
| Key Resistance | $106,000 / $107,000 / $108,150 |
| Key Support | $104,200 / $103,150 / $101,200 |
| RSI (30-min) | 45.2 (bearish tilt) |
| MACD (30-min) | Bearish crossover |
| Stochastic RSI | Overbought (85–86) |
| DMI | Weak trend, low ADX |
| Bollinger Width | Contracting – breakout likely |
| Fib Levels (Daily) | 0.5: $105,485 / 0.618: $104,291 / 0.786: $102,590 |
Bitcoin balances on the edge of a knife. One fearsome bull run through $106,300 would be all that was needed to seize control from the bears and bring in a new rally. Failure would awaken the once-dormant bearish forces to drag prices down to the chilling lows of $103,000. The market is holding its breath as it awaits the glorious rise and towering fall.
Heads up!
An article such as this is a friendly exploration, not an itinerary for making money. What we intend to do is impart some knowledge and are in no way rendering investment advice. Coin Edition will not be held liable for any investment decisions made on the basis of reading this. Do your due diligence and plan your own moves carefully. Your wallet will say thank you.
Thanks for reading Bitcoin (BTC) Price Prediction for June 16 2025: Can BTC Hold the $104K Pivot Amid Bearish Pressure?
 Ethereum (ETH) and XRP!")
