Related Articles

The climb of Bitcoin from under $90,000 in April is starting to feel like a faraway memory as digital gold struggles to breach the $105,000 mark. The rally is slipping away, presently straddling $104,000. The daily chart issues a warning: BTC has entered a danger zone, one that is so-called supply areas and that tend to provoke violent price reversals. Is it that the bulls are running out of courage?
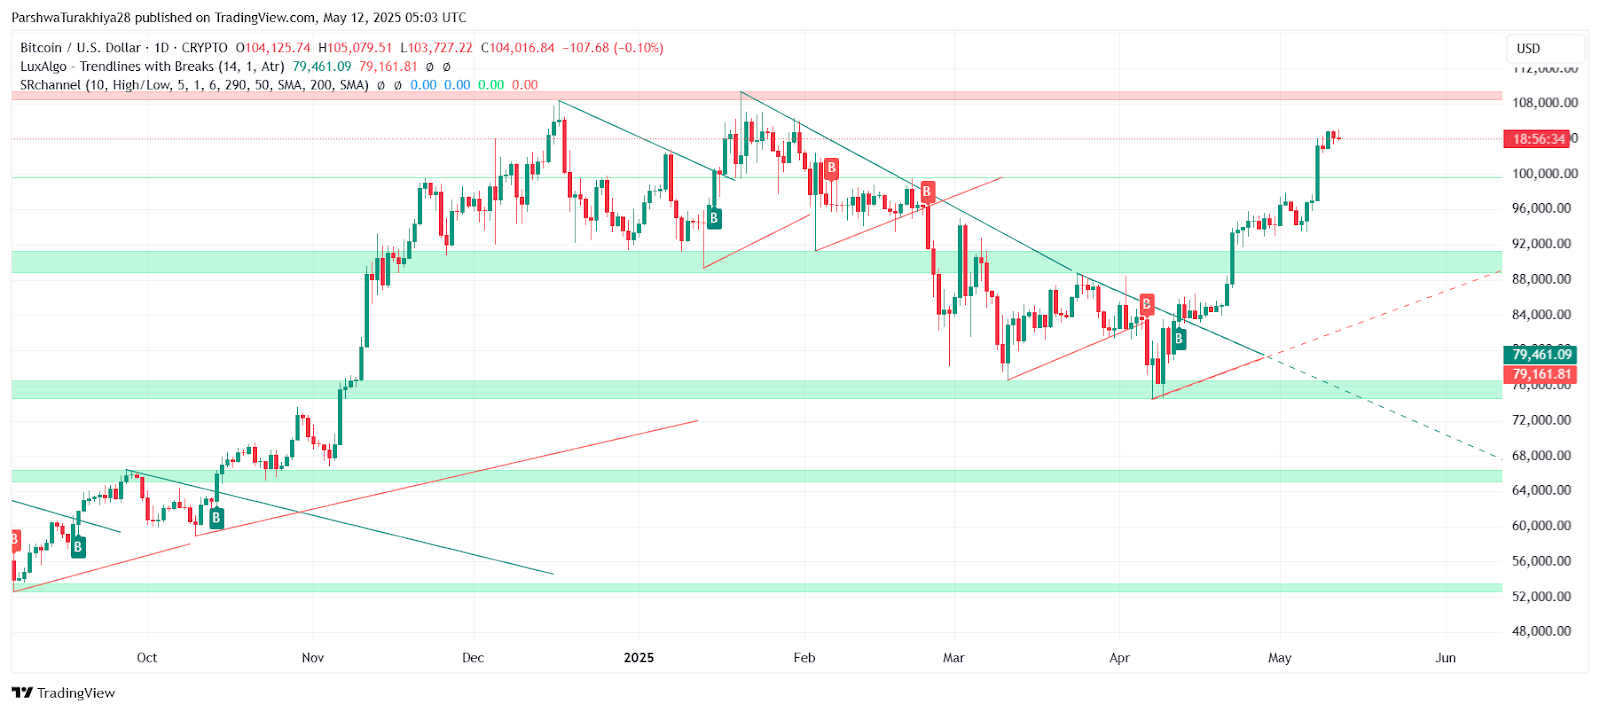
BTCUSD price dynamics (Source: TradingView)
Bitcoin, propelled by a surge over $95,000, is confronted with its most formidable barrier to date: the $104,000-$106,000 wall. This area, having been sanctioned by multiple historical rejections, now stands as the major test ahead. Currently giving a sideways signal, Bitcoin is down by an insignificant fraction of a percent, suggesting that it may be taking a breather after a week full of bullish fireworks.
Bitcoin Price Action Near-Term: Key Indicators Show Divergence
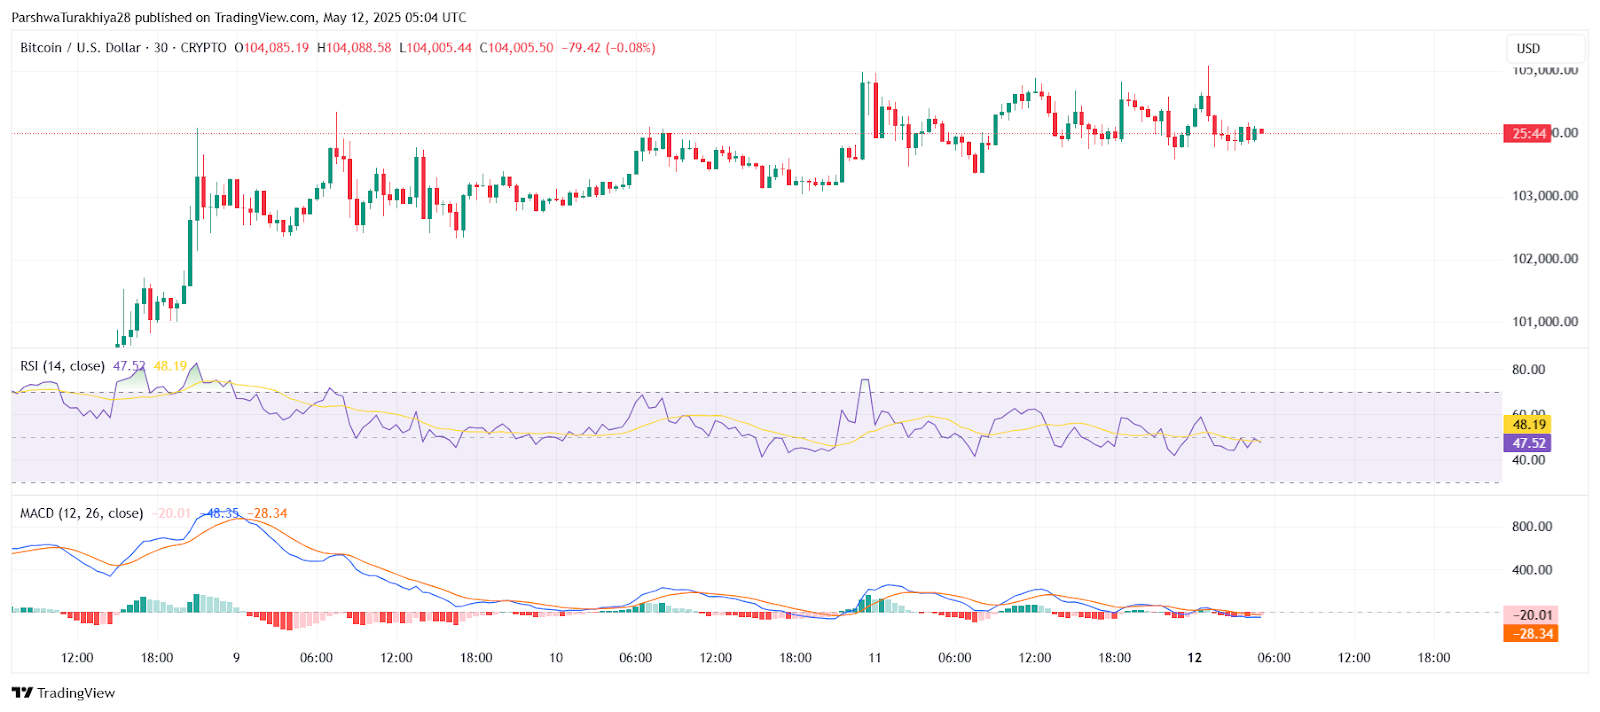
BTCUSD price dynamics (Source: TradingView)
BTC’s 30-minute chart paints a picture of a market taking a breather. After its recent climb, Bitcoin is now shuffling sideways, like a climber pausing to survey the peak. The RSI, dipping just below the 50-mark at 47.5, whispers that the bulls are losing steam. The MACD histogram echoes this sentiment, its bars shrinking near the zero line, hinting that the upward push is fading. This plateau confirms what the chart already shows: since May 10th, Bitcoin has been stuck in neutral.
With calm before a storm? Bollinger Bands continue to coil more tightly around the resistance mark of $104K, indicating an impending breakout. But never rush; indecision rules. If you observe the dropping candles, they are telling a story about a market that is holding its breath. Buckle up, because the next 24 hours could be the roller coaster of volatility.
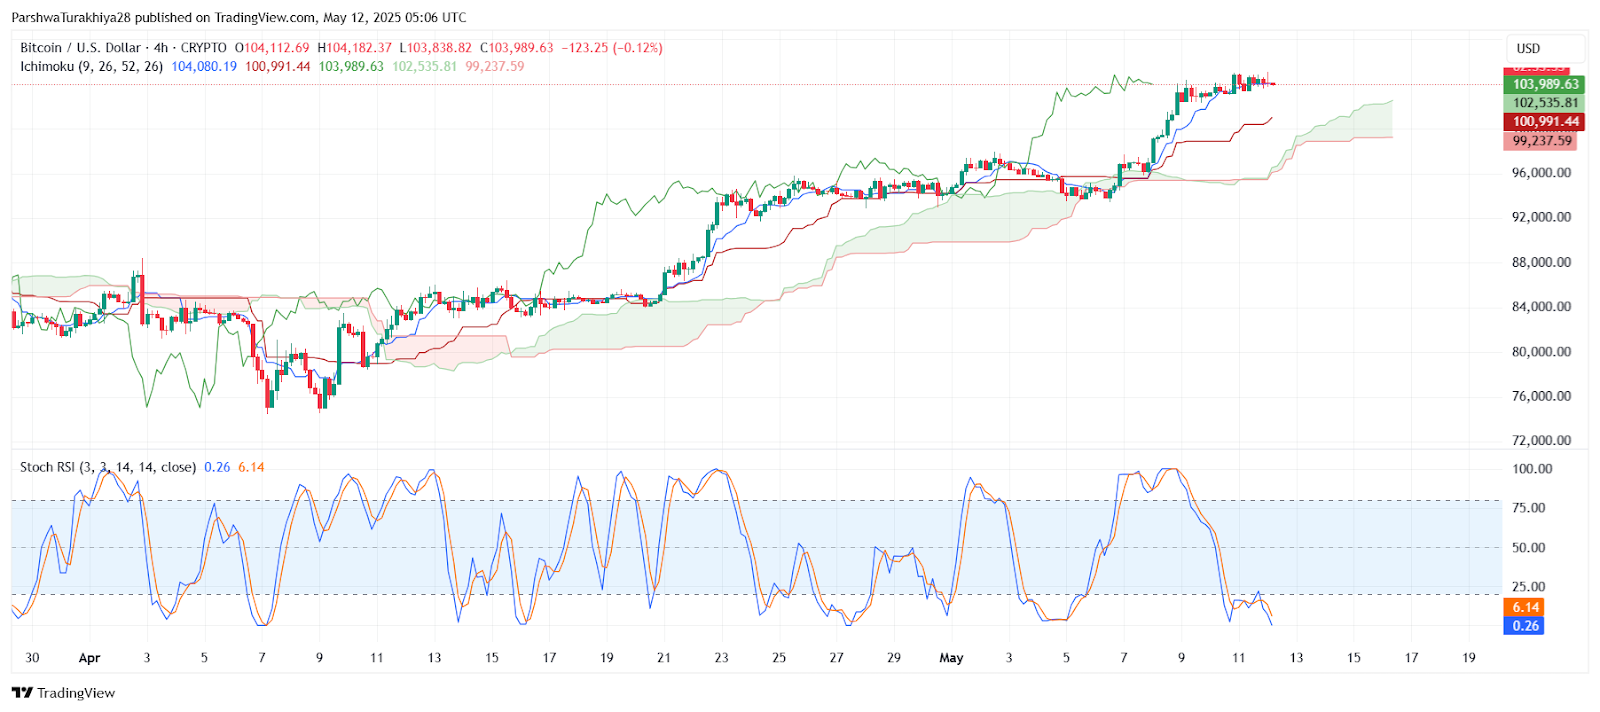
BTCUSD price dynamics (Source: TradingView)
The 4-hour chart of Bitcoin depicts calm before a potential storm. The Ichimoku Cloud shows BTC drifting above it, whereas flat Tenkan-Sen and Kijun-Sen lines tug away at the notion of an exhausted trending process. Should volatility wake up, the breakout had better be explosive.
Why Bitcoin Price Going Down/Up Today? Battle at $105K Defines Outlook
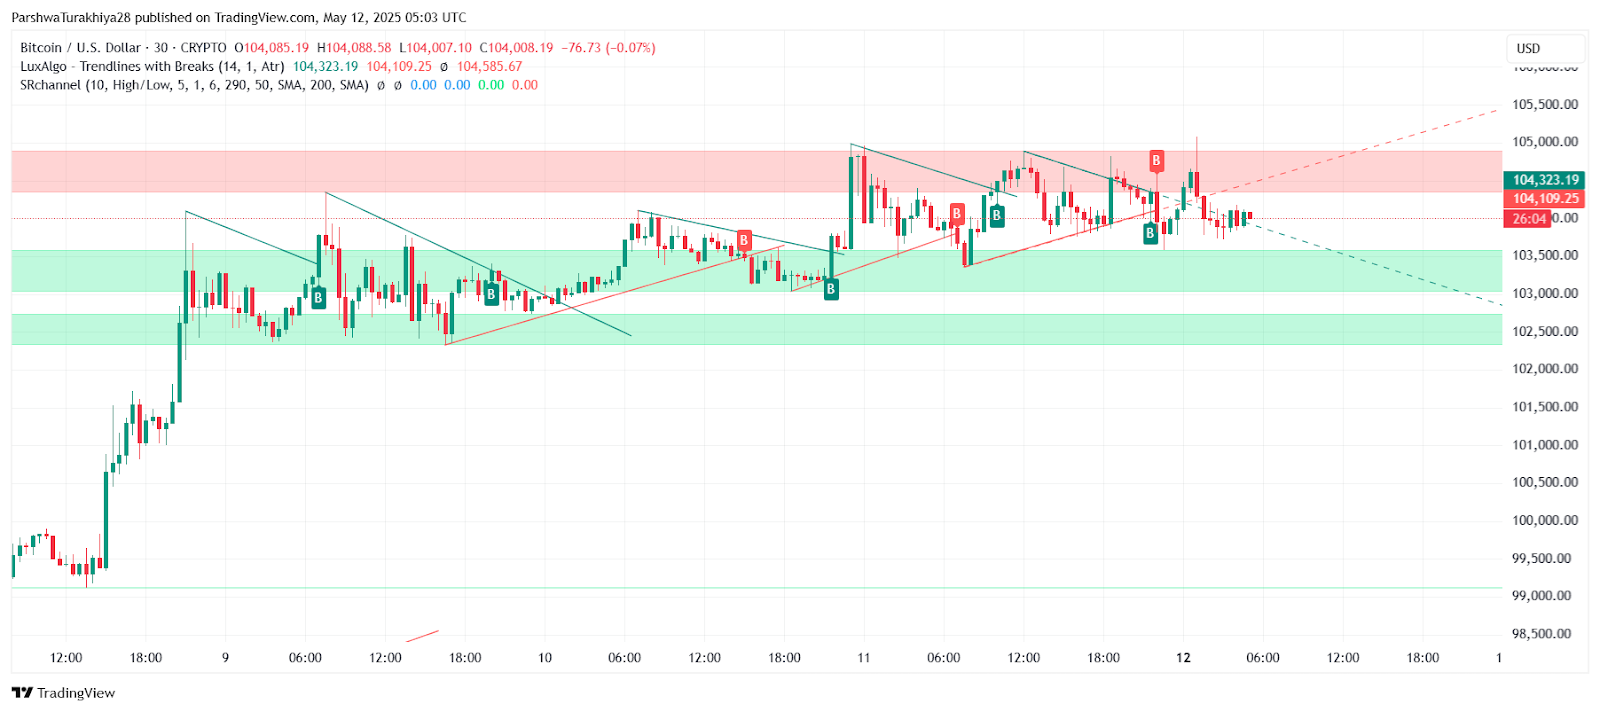
A tug-of-war ensues. $104,800 is the doubtful line to be crossed, whereas $103,800 is the solid floor that shall not give in. This is a battlefield, an arena of stalemate formation from where neither bulls nor bears can claim victory during this 30-min chart, as it lies in its lonely consolidation awaiting the next macro thrust. Which side breaks first?
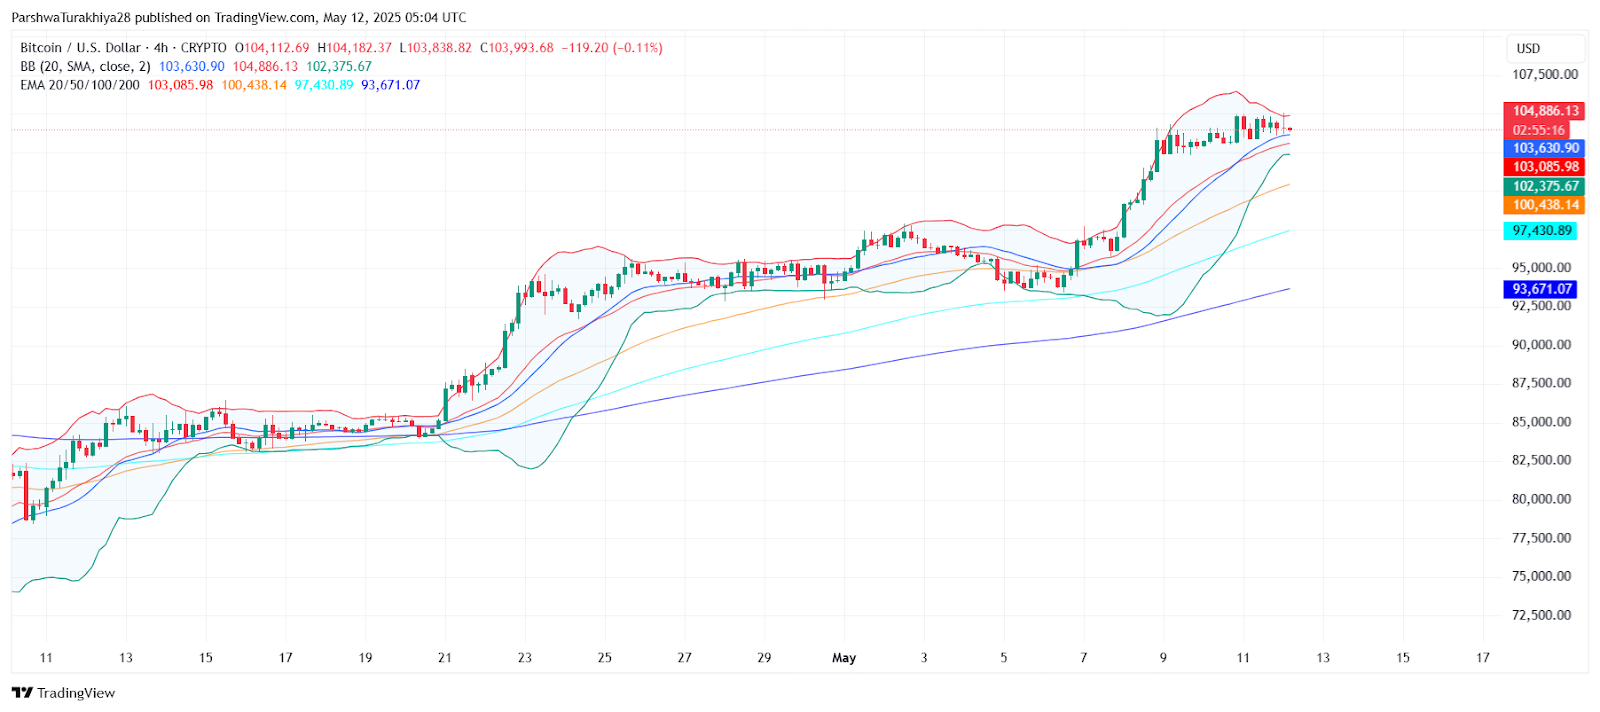
BTCUSD price dynamics (Source: TradingView)
The explosive ride of Bitcoin has encountered a stumbling block! After a textbook triangle breakout sent the price above $101K, bulls are having difficulty surpassing $104.5K. Intraday charts are throwing caution signals: the trendline is breaking, and volume is murmuring the word “correction.” Key level to watch: $103.5K. Lose that, and dips could occur.
The bullish rally was looking very strong; however, since the sellers are threatening, the price can still come down further. Buyers maintain control above the 200 EMA ($97,400 on the 4-hour), but resistance is now forming. If prices remain unbreakable at $105K, then expect an aggressive retest of the $102,500–$103,200 support zone. Keep an eye on it, as this could define our trend from here on out.
Bitcoin Price Forecast for May 13
BTCUSD price dynamics (Source: TradingView)
Bitcoin Bulls Eye $110,000: Can They Smash Through Resistance?
All eyes are set at Bitcoin, as bulls attempt to overcome the $105,200 mark. A sharp bullish move above this level may then take Bitcoin towards $107,500 and perhaps the highly coveted round figure of $110,000. The confirmation of a breach above this level might immediately trigger a surge in new long entries, which in turn may foster the formation of the next big bull run.
If Bitcoin were to give way under $103,000, watch out for a downhill ride. One might see the price retrace to $101,500 and even visit the site of its earlier breakout near $99,000. The last stand for bulls has been the defending of the $100,000 level with great resolve – an ingrained psychological level, buttressed by EMA confluences and Ichimoku clouds.
Bitcoin’s coiled spring: On the 4-or-clock, Stoch RSI ominously barks oversold, with MACD flatlining to deck an imminent eruption in prices. Eyes glued to volume- surge could confirm if Bitcoin blasts off or breaks down.
BTC Technical Forecast Table: May 13
| Indicator/Zone | Level (USD) | Signal |
| Resistance 1 | 105,200 | Short-term breakout zone |
| Resistance 2 | 107,500 | Next upside target |
| Support 1 | 103,000 | Near-term holding level |
| Support 2 | 101,500 | Breakdown trigger |
| 200 EMA (4H) | 97,430 | Strong dynamic support |
| RSI (30-min) | 47.5 | Neutral to weak |
| MACD Histogram | Near Zero | Flat momentum |
| Bollinger Band Width | Tight | Volatility expansion likely |
Consider this your compass and map and never to be taken as a treasure map etched in stone. These insights are offered for the purpose of exploration and education only and are by no means binding financial decrees. Think of Coin Edition as your guide and not a certifier of your actions. We highlight the possibilities and do not advise which path to take. Remember, the waters of cryptocurrency are unpredictable. They chart their own courses, so be cautious and understand that taking any path involves certain risks. Before setting sail on anything here, navigate carefully and doublecheck your bearings.
Thanks for reading Bitcoin (BTC) Price Prediction for May 13
 Ethereum (ETH) and XRP!")
