Related Articles

Bitcoin’s thrill ride isn’t over yet! After touching a near-record high, the price is dipping-a dip or a dive? Grab your charts because we’re diving deep into technicals to figure out that next big move for Bitcoin.
Witnessing the roller coaster ride was an excellent example of proving that cryptocurrency markets dance to their own unpredictable rhythm. The cryptosphere initially erupted in a frenzied buying activity after the cooler-than-anticipated CPI data. Bitcoin fleetingly surged past $110,000; Ethereum cosied up to $2,880. However, this uplift was ephemeral. CPI, indicating a 2.4% rise in inflation against an expected 2.5%, instigated an immediate and absolute “buy the rumor, sell the news” scenario, where traders cashed out on their profits. As a result, Bitcoin lost 1.2% to $107,369; Ethereum dropped 0.96% to $2,746, leaving investors pondering the foretelling of tomorrow.
The technical landscape gives a sense of calm, as it were, amid the crypto storm. Both the assets range about their given upward channels, hinting toward this dip being just a breather rather than the full-blown U-turn. On the other hand, the Crypto Fear & Greed Index, our market mood ring, didn’t move much at all, slipping barely from ‘greedy’ 72 to a cool ‘less excited’ 71. The market seems to be chilling.
Bitcoin holders take profits near all-time high
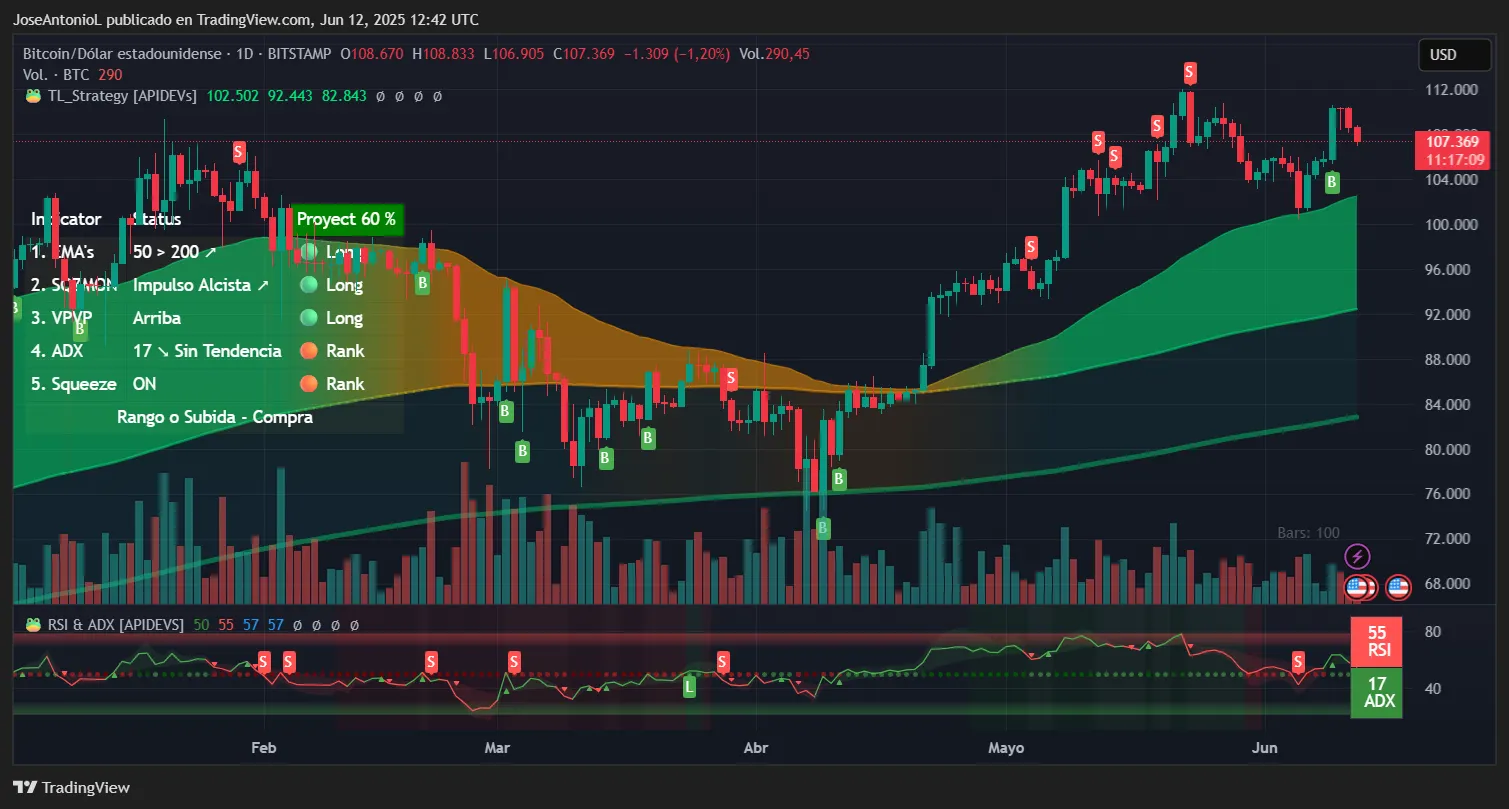
Since mid-May, Bitcoin has spent time resting above the 50-day EMA on the daily charts, with that horizontal launchpad being built. Consider this a proper breather after a strong recovery rally that sweapt away the dips of February-April. This green channel is the key. In all chances, if Bitcoin stays inside, these are bullish vibes with eyes on charts for trades.
Bitcoin has stopped to take a breath. The RSI, one important momentum gauge, is now hovering at a balanced 55. Just see it like Bitcoin catching its breath mid-marathon. It has stepped back from its sprint, but it is far from collapsing. This reading suggests there is still ink in the tank for another surge to overbought readings above 70. The RSI studies price momentum: Is the rally based on solid grounds or is it like a house of cards that will soon be toppled? Currently, it says the former.
An A.D.X. reading of 17? No fireworks coming out this time. The market is barely whispering. A.D.X. suggests, there being only a tentative trend, some consolidation. The EMAs, however, are telling a different story. The 50-day EMA remains high over the 200-day EMA, confirming that the bulls have had long-term control for some time. Short-term traders price above their long-term counterparts in other words. Standing off a longer timeframe- the broad frame is bullish.
“$103,000: the line in the sand. Breach it and bears will take control, probably raining down on price. But if bulls defend this rising channel floor, strap in for a rocket ride back to record highs.”
Despite the dip, Ethereum is still bullish a bit more than Bitcoin
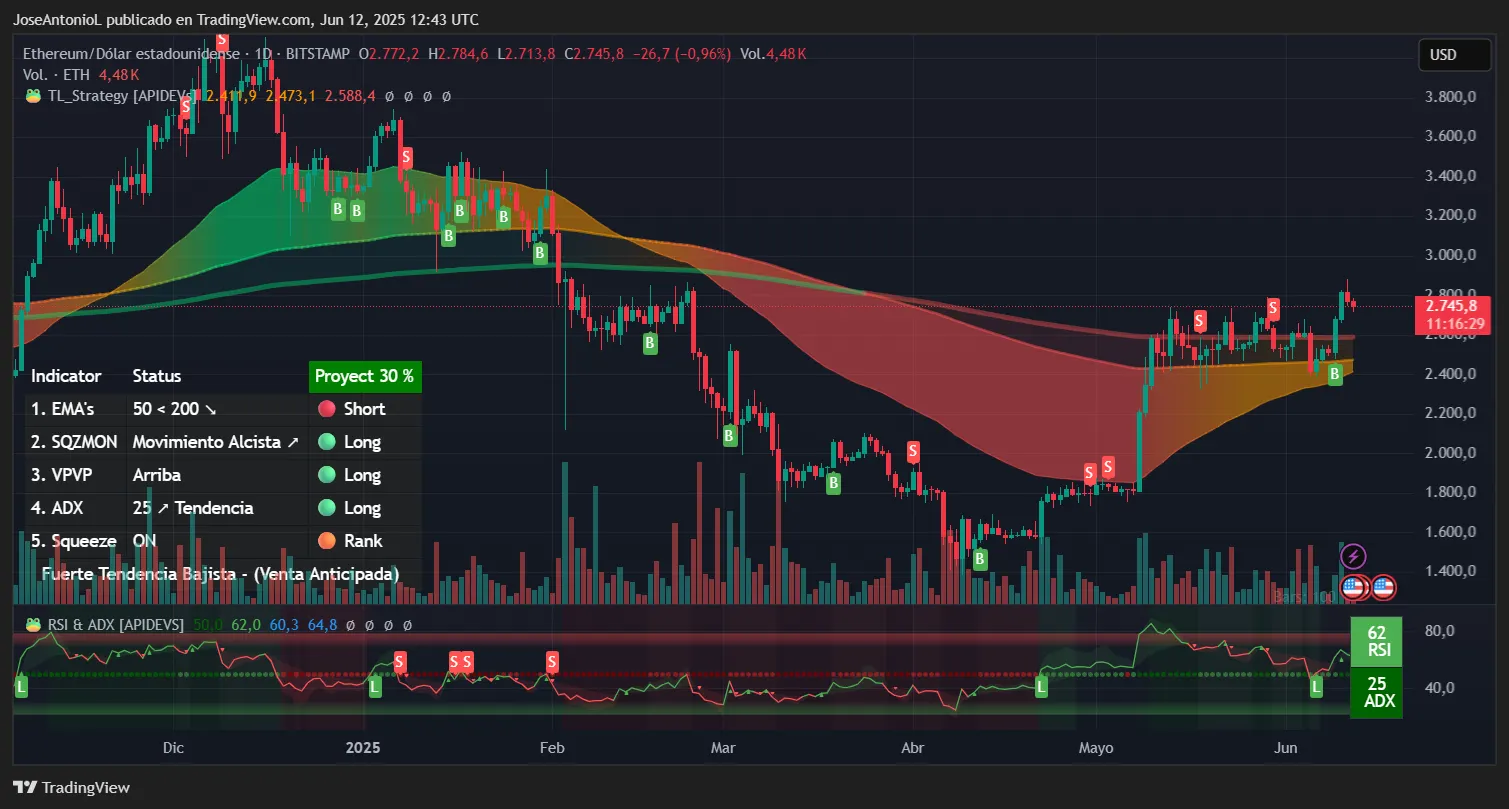
This is actually Bitcoin being left in the dust by Ethereum. After a fresh May 8th spike, ETH had drawn a horizontal channel between $2,400-$2,700. Instead of languishing, Ethereum has blasted through the roof. Bitcoin looks sideways, whereas Ethereum price action screams bullish. Multiple successful tests of the channel support have fueled the engine. Confidence is building at lightning speed.
Technical momentum indicators show more optimism among ETH traders.
Ethereum’s RSI flirts with overbought levels at 62, suggesting a final pressure on price to accelerate before the tide changes. Will it be able to pass through, or is this the last maximal effort of the bull run before a full-fledged price correction takes place?
Ethereum’s shifts are flashing some remarkable muscle with the overshadowing signals of Bitcoin. The ADX has been shouting a much clear story for Ethereum, but it seems that the trading floor has been quiet, with volume taking a firmer grip.
“$2,400-$2,500: The launchpad called for. Smart money is now attempting to enter at these levels, with the risk overshadowed by the rewards. Shoot past $2,850, and we’re slingshotting straight up to $3,000, then $3,300. Buckle up.”
Bitcoin teeters on the $104000-$105000 line-in-his-weather-in-the-sand. Breach this, and brace yourself for bullish institutions. Fall through, and get ready for a steeper dive. The fate of Ethereum rests at $2,850. Overcome this ceiling and watch flow gates be thrown open by the institutions. Fail at this point, and corrections will be due. All is decided by either next breakout or breakdown.
Thanks for reading Bitcoin Ethereum Slip After CPI Shock—But Charts Still Say Not Bearish: Analysis
 Ethereum (ETH) and XRP!")
