The price of Bitcoin (BTC) began a sideways decline below the $120,000 mark after its recent high.
Bitcoin price long-term prediction: bullish
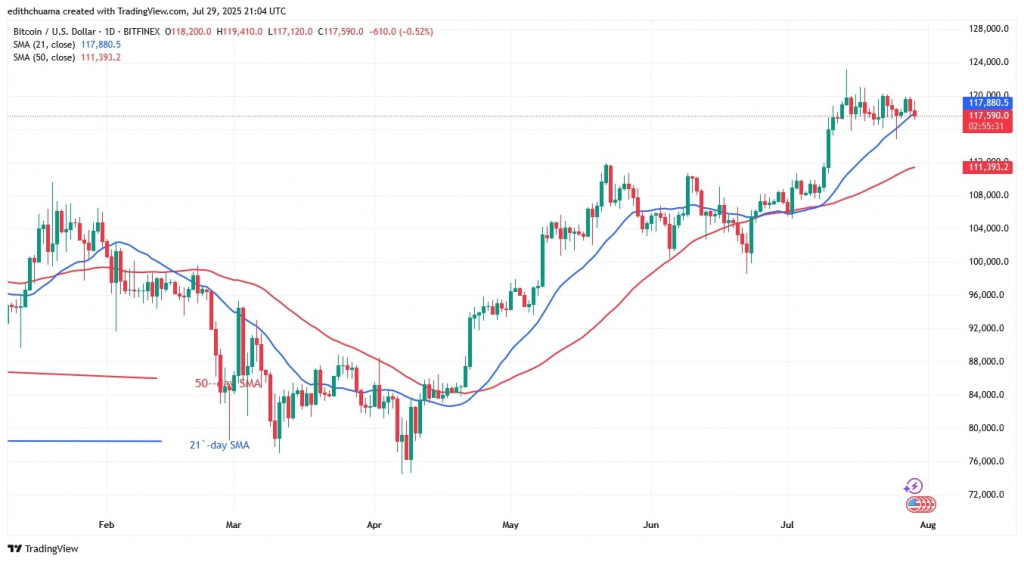
Bitcoin’s rally hit a wall on July 14th, Coinidol.com reported, as it slammed into resistance at $123,120. A long, ominous candle wick signaled a swarm of sellers ready to cash out. The crypto king now teeters just above its $116,000 support, a far cry from its recent $120,000 peak. Is this a brief pullback or the start of a deeper slide?
Bitcoin’s poised for a potential bull run, but needs to shatter the $120,000 ceiling first. Clear that, and eyes are on $133,000. However, beware the bears! A dip below $116,000, or worse, the 21-day SMA, could trigger a sell-off. Currently, BTC teeters below its peak, priced at $117,476, leaving traders on edge. Will it break free or succumb to the pressure?
BTC price indicators analysis
Bitcoin teases the $120,000 ceiling, a trio of imposing green candlesticks piercing the barrier, yet shadows linger. Long wicks betray fierce resistance, sellers swarming at this psychological peak. Bulls, beware the Icarus trade.
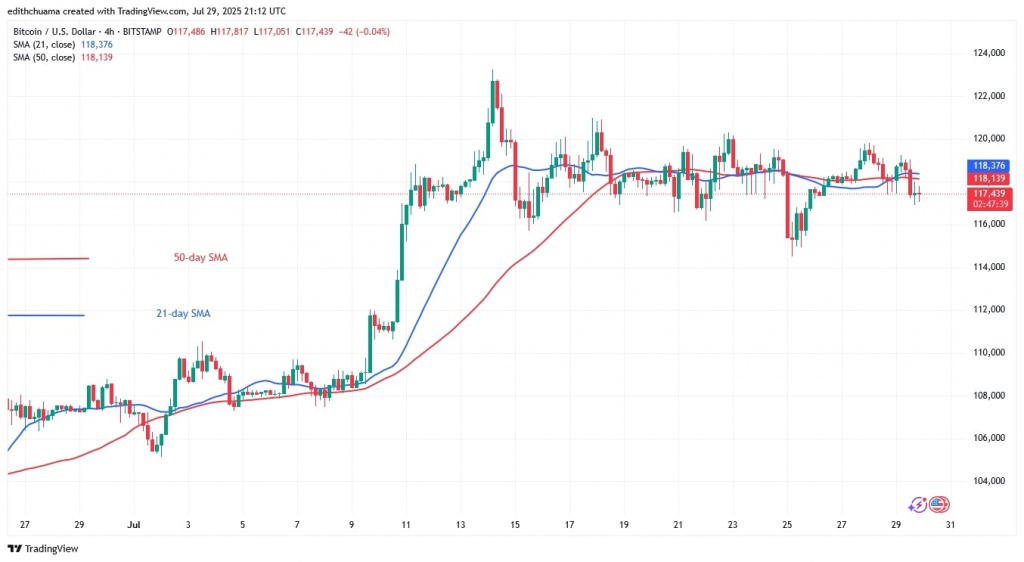
Zooming in, the 21-day SMA, a swift sprinter, outpaces the 50-day SMA, tailing closely behind the price action, hinting at underlying momentum. But caution whispers from the 4-hour chart: the moving averages lie flat, painting a landscape of indecision. Bitcoin, it seems, is caught in a sideways dance, a tense standoff at the $120,000 gate. Will it shatter the resistance or retreat into the lull?
Technical indicators
Key supply zones: $110,000, $115,000, $120,000
Key demand zones: $100,000, $95,000, $90,000

What is the next move for Bitcoin?
Bitcoin’s bull run hits a $120,000 ceiling! The 4-hour chart paints a picture of sideways shuffle, trapped between a $116,000 safety net and the $120,000 resistance. A flurry of doji candlesticks suggests a market frozen in place, traders locked in a high-stakes staring contest, unsure whether to buy the dip or brace for a correction. The next move will determine if Bitcoin breaks free or falls back.

Heads up! This is just my personal take on things, not official investment advice from CoinIdol.com. Think of it as food for thought, not a crystal ball. Before you dive into crypto, grab your own shovel and do some digging!
Thanks for reading Bitcoin Is In A Sideways Trend Below The $120000 Mark


