Related Articles

Bitcoin is seeing a breathtaking climb, clawing its way back from its sub-$102,000 level. In clear view of a $112,000 fortress, the rally is visibly losing steam, with its strength trapped around $111,150. This remains a pause, the maiden one after an explosive breakout on May 20. On that day, Bitcoin let go of shackles in the trendline and shot past age-old supply barriers akin to a rocket passing Earth’s gravity. Is that a refueling stop before the next jump, or is it the edge of the cliff?
Highlights:
- Bitcoin price today hovers near $111,150 as bulls face $112K resistance
- RSI and MACD point to fading momentum after recent breakout
- Key support zone rests between $109,200 and $108,300
And suddenly there came this pause after the anticipated Bitcoin stampede; the bulls now charging forward, but the formidable wall is threatening to stall the rally. The overall trend favors the bulls, but cracks start to appear in the short-term foundation. Keep a keen eye on sideways movements or even a temporary pullback if these key support levels around $109,200 and $108,300 fail to hold.
What’s Happening With Bitcoin’s Price?
BTCUSD price dynamics (Source: TradingView)
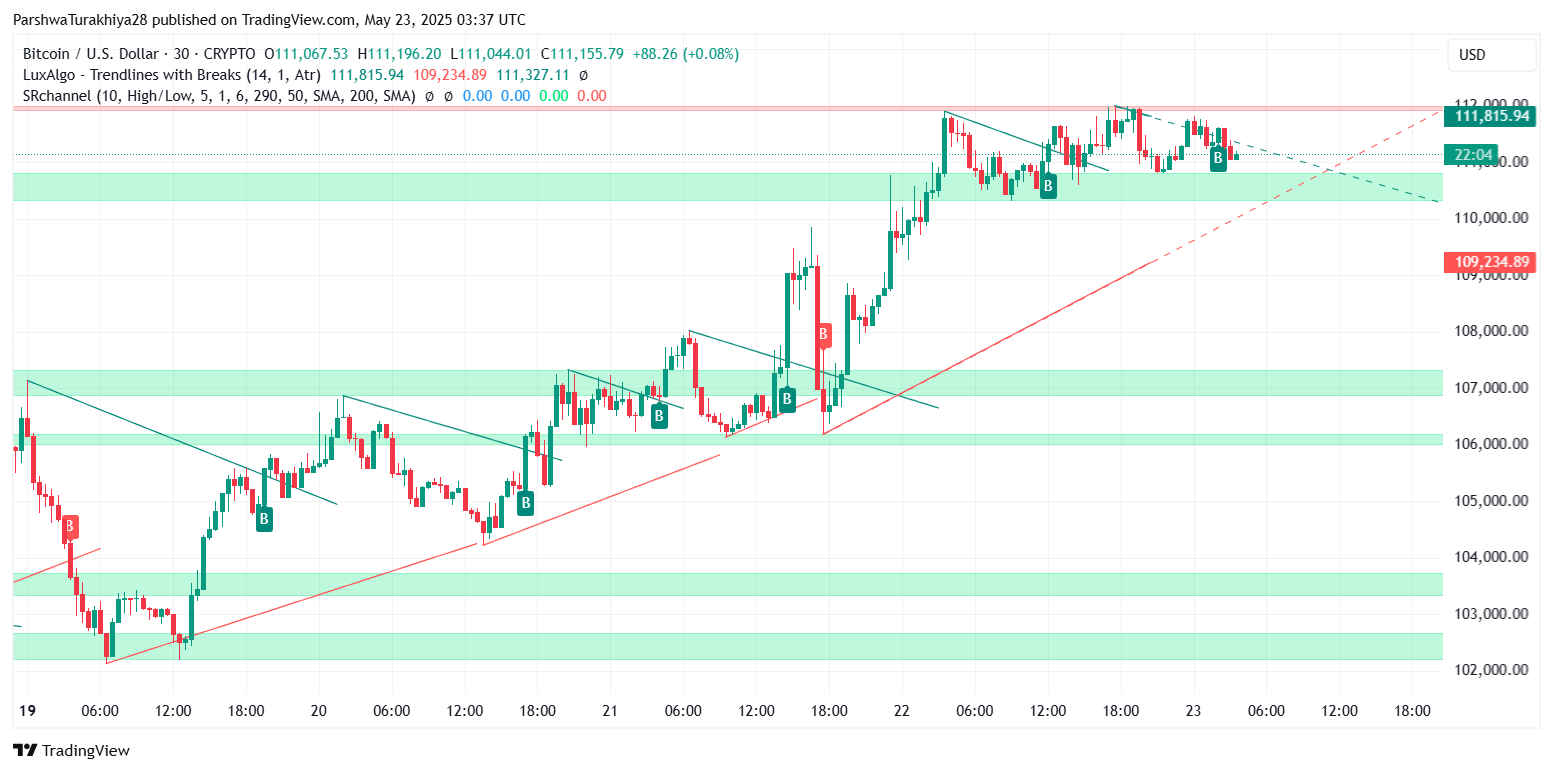
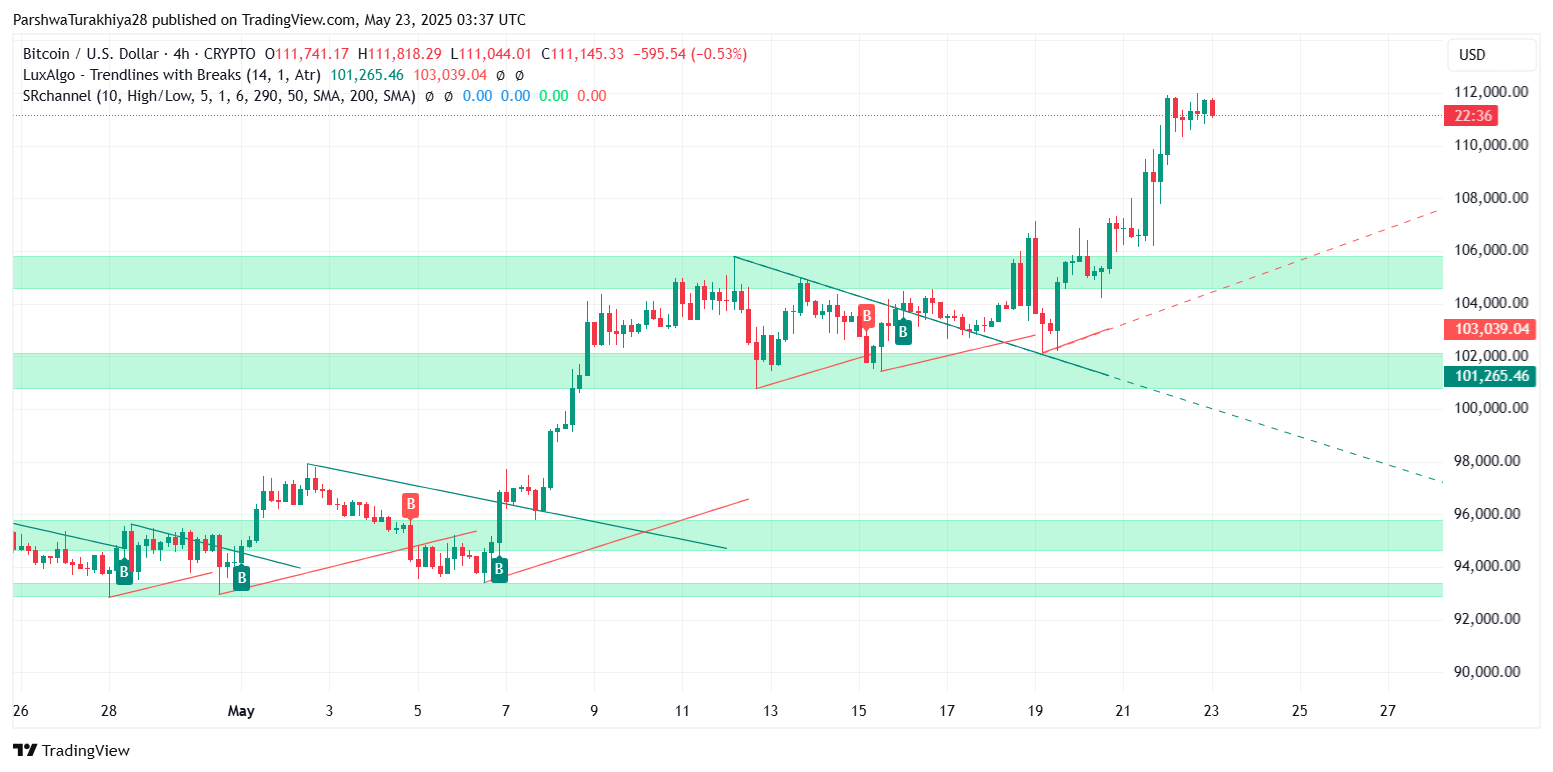
Bitcoin has been flirting with us in the last few days, hasn’t it? In the 30-minute timeframe, imagine it as an ascending wedge tightening like a coiled spring, going to explode through the $112,000 ceiling. But the ceiling is a stubborn one. Since May 21st, Bitcoin has been hitting its head against it, with everything else being a frustrating wick and eventually rejection. But change the timeframe to 4 hours, and the story changes. The bullish phalanx of EMAs–the 20, 50, 100, and 200–marches all together upward, signaling a strong medium-term uptrend. Will the wedge break out of its bindings, or will the ceiling hold? The charts give an almost audible whisper of a breakout, yet only time shall be the judge of whether Bitcoin can make it happen.
BTCUSD price dynamics (Source: TradingView)
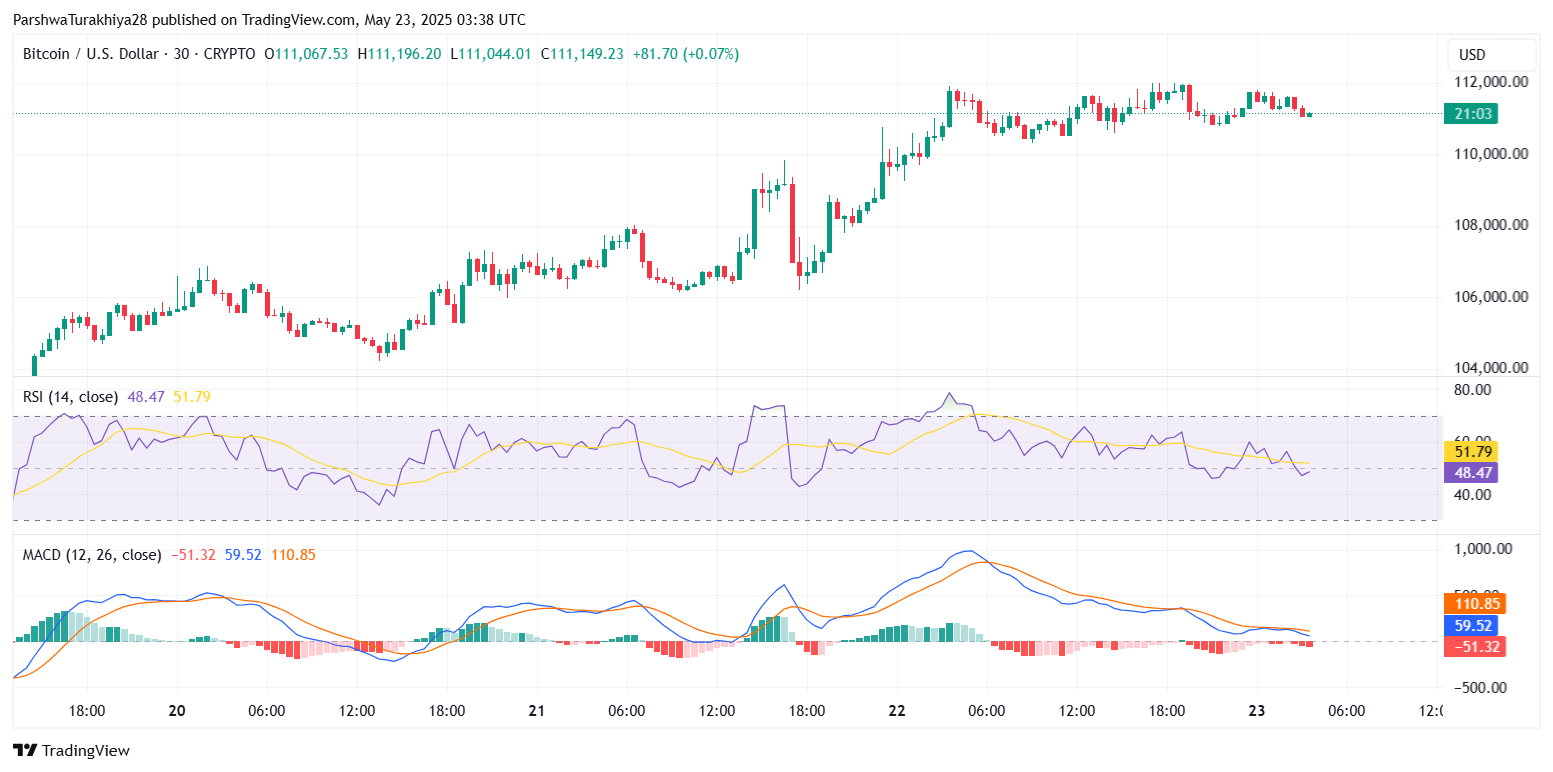
Now, if that buildup was to generate some quick rush, it might just be losing steam. The RSI that was screaming “too hot to handle” just moments ago now decreased to a lukewarm reading of 48.47. At the same time, MACD executed a clean bearish crossover and has since drenched the histogram in crimson paint. Such loss in momentum, plus the price repeatedly hitting resistance, suggests that our asset may be pausing for a bit before staging its next act.
Key Resistance Holding as Price Struggles to Breakout
BTCUSD price dynamics (Source: TradingView)
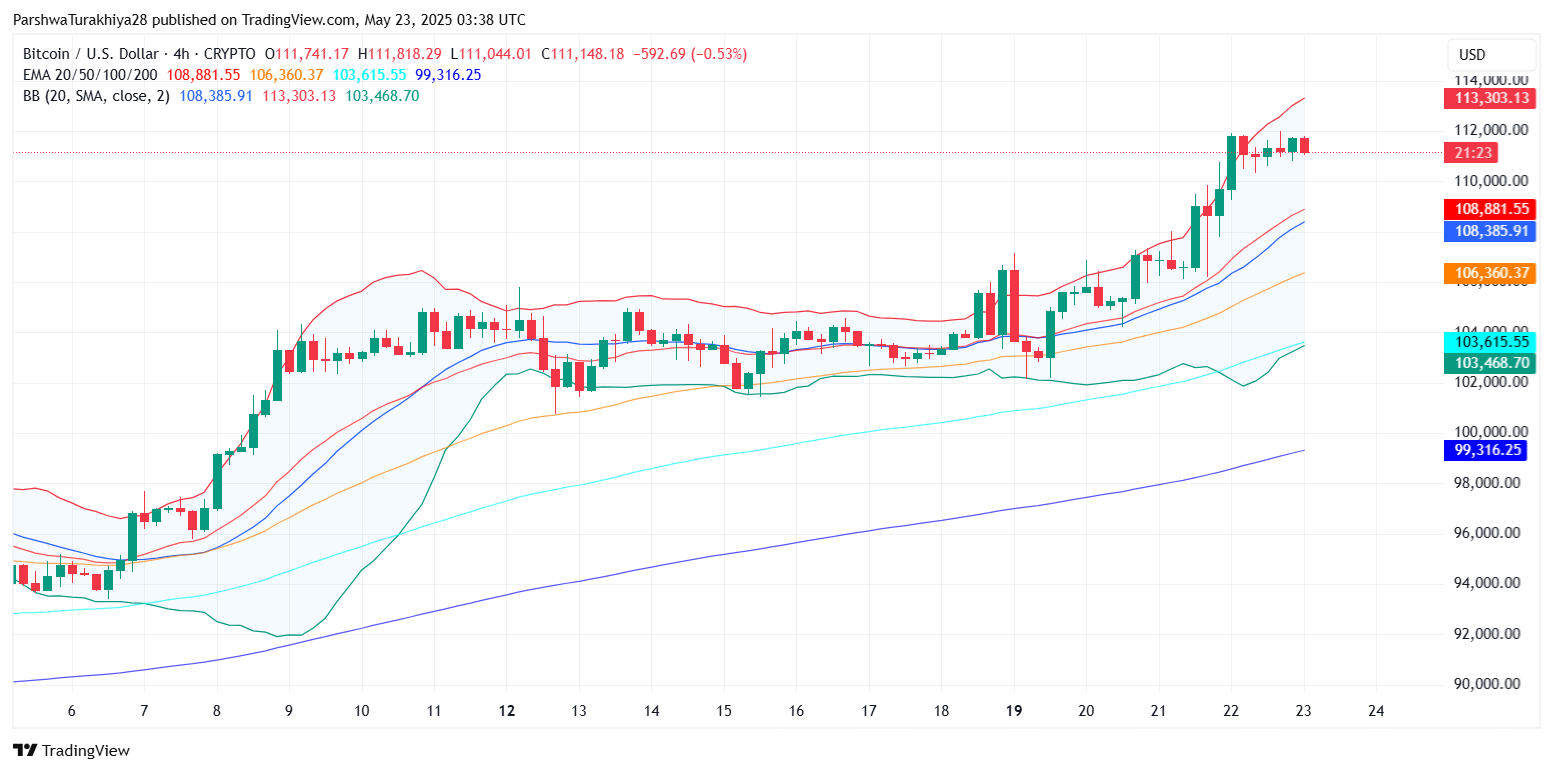
The bullish rallyers stormed the bastion of $112,000, only to see stumbling stones drop repeatedly onto the price. Each upward surge was met with a swift rejection, leaving adverse gravestones etched on the chart. A bunch of these rejections occurred near the upper limit of the Bollinger Bands present on the 4-hour chart, a blazing warning sound signaling extreme Bitcoin volatility. This calls for stormy weather ahead.
BTCUSD price dynamics (Source: TradingView)
Bitcoin is hanging by a thread! The zone between $109,200 and $108,300 is do-or-die. This isn’t just any random support; it is where the 20 and 50 EMAs converge, the launchpad that powered the last rally. If it goes below $108,000, then it’s all down from there! Next to hold is $106,300, but in the event it does not, $103,600 is all that’s left.
BTCUSD price dynamics (Source: TradingView)
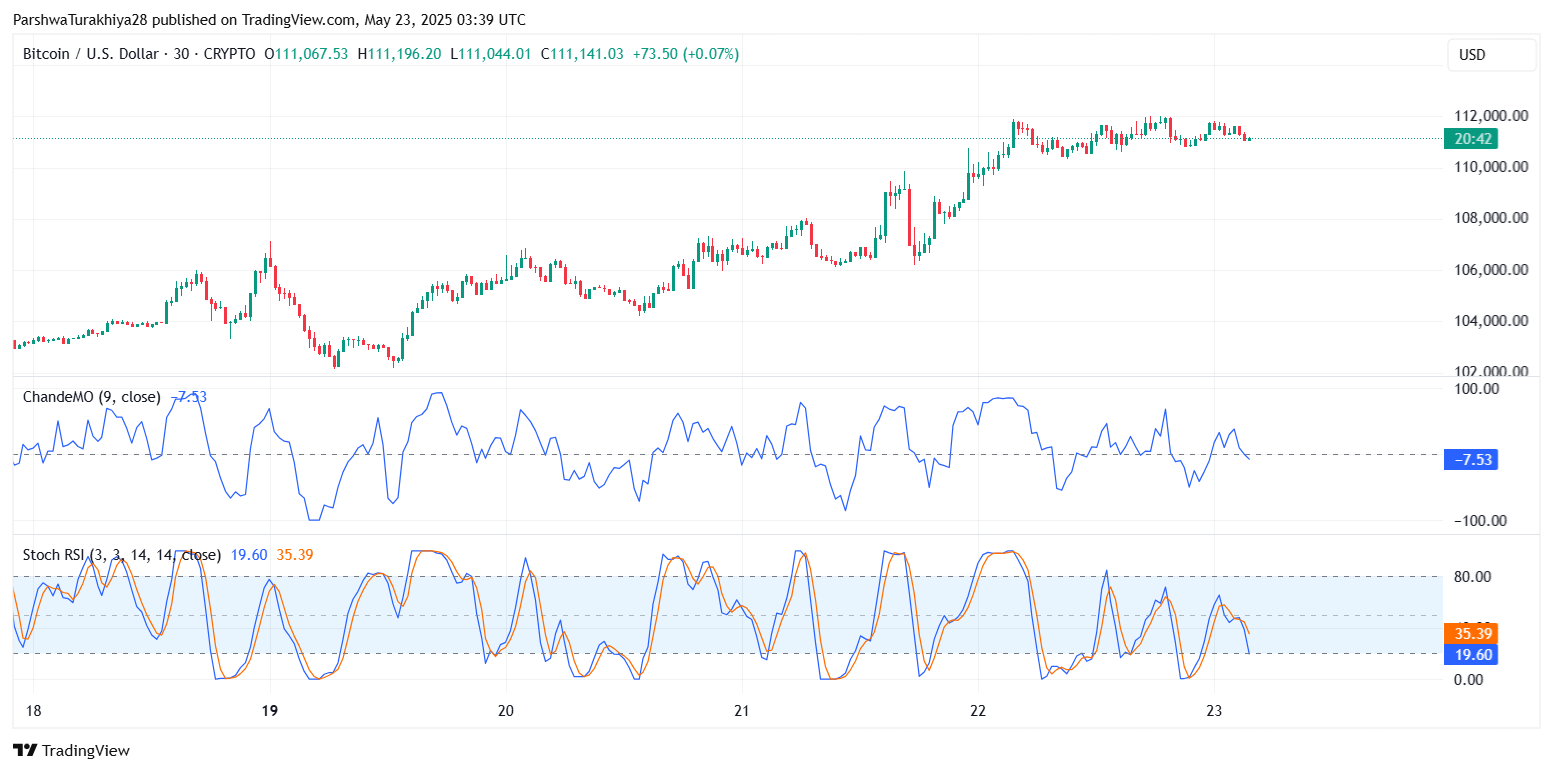
Bearish signals abound for the lower timeframed charts: the Stochastic RSI just slipped into the territory of oversold, while the Chande Momentum Oscillator is now riding the waters of negativity. Brace yourselves – these bearish clues hint at some short-term pullback or sideways crawl.
Why Bitcoin Price Going Down Today?
BTCUSD price dynamics (Source: TradingView)
Bitcoin’s Bull Run Brakes: Technical Exhaustion or Profit-Taking?
That rocket called Bitcoin, hurtling past $112,000, hit a snag today. Was it a crash landing, or a refuel stop? Technical exhaustion is said to be the culprit. After the grinding upwards from $102,000, Bitcoin seemed to be getting tired away. RSI divergences and vanishing MACDs are louder than ever screaming momentum waning. The smart money might just be cashing in close to that tempting $112,000 psychological barrier. Even intraday and daily charts are showing resistance that adds strength to the sell-off. Is this just a temporary resting stop for the next leg up, or the beginning of a deeper correction? Time will tell.
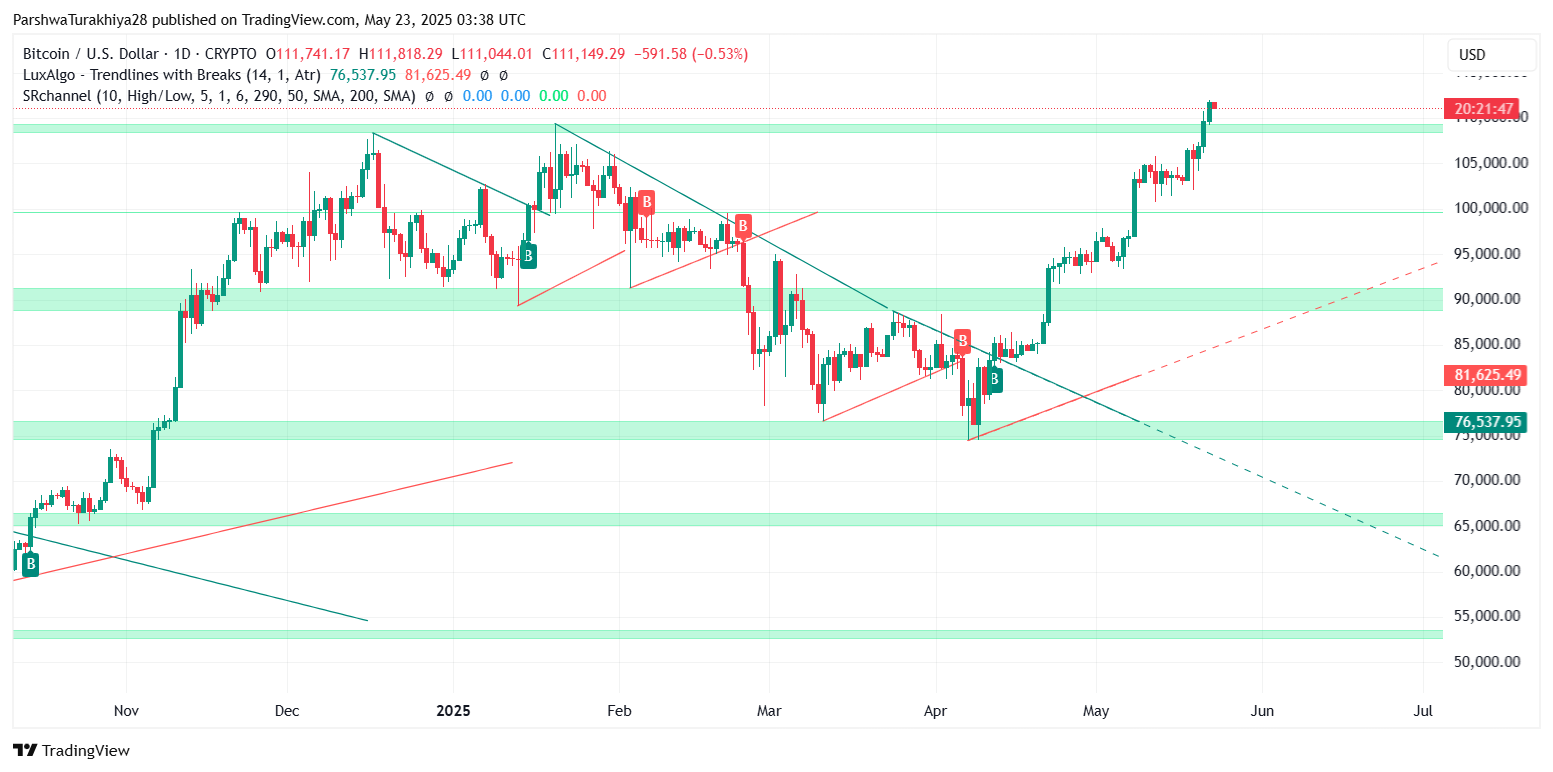
Bitcoin stands at an extreme high-risk level! The ascending triangle, typically a pattern that indicates bullish continuation, is now being severely tested. A fall of Bitcoin below the fortress of $110,500 should bring about a rapid decline. $108,800 is right now the significant battleground, an ultimate line of defense against a deeper retracement. Get ready, bulls, as this is either the fight or a temporary pullback prior to the next rally.
Short-Term Outlook for Bitcoin Price
Bitcoin has hit a brief lull, but zoom out, and the bigger picture just shouts GOING UP! Think of it as a marathon and not a sprint. Provided that Bitcoin does not give away the $106,000 levels, the bulls shall be in charge.
And now comes the thrilling part: Break $112,000 and stay above it…prepare for liftoff. We are looking at a quick stop at either $114,000 or $114,500 before heading for the $118,000 summit. Eyes glued on the charts; it may get wild.
The loss of the $109,000 battleground could, therefore, open the door for the price to retreat towards the $106,000–$103,000 zone. Holding these lines is paramount for the bulls to survive as we head into the final showdown for May.
BTC Forecast Table
| Timeframe | Support Levels | Resistance Levels | Indicators | Signal |
| 30-min | 110,000 / 109,200 | 112,000 / 114,000 | RSI: 48, MACD: Bearish | Neutral-Bearish |
| 4-hour | 108,800 / 106,300 | 113,000 / 114,500 | EMA: Bullish Stack | Bullish |
| Daily | 103,000 / 99,300 | 118,000 / 121,000 | Bollinger Bands: Tight | Bullish |
Bitcoin’s bull run is slowly taking a step back! After a torrid surge, the king of crypto is shyly tiptoeing on the knife’s edge. Generally, bulls still dominate, but the clouds are starting to gather in the west. All eyes are on two major levels: $109,200-the ultimate line of strong defense-and $112,000-to launch anything to uncharted territory. Will Bitcoin break resistance and start its journey once again, or will the bears drag it down for a second time? The next move determines everything.
Thanks for reading Bitcoin Price Prediction for May 24: Bulls Pause Near $112K as Breakout Momentum Cools
 Ethereum (ETH) and XRP!")
