Related Articles

May 29th, 2025: Bitcoin came roaring above $108,000. One Bitcoin is worth a staggering $108,776, pushing up market capitalization to $2.16 trillion. Even with money movements of $32.47 billion in one day, this ride has been a roller coaster. Traders have faced an extremely volatile 24 hours, bouncing between $107,107 on the lows and $109,057 on the highs, with Bitcoin struggling to lock its gains. Is this the new normal, or just a pit stop before soaring to even greater heights?
Bitcoin
A Bitcoin bull run, Assumed late near the 91700 mark, is showing the usual signs of end-game onset. After flirting with the $112,000 level, however, the daily candles depict a dying momentum. The strength in the $108,000-$109,000 range is failing to hold, compromising volume and price. This episode of selling saw a big red candle formation followed by a lull, reflected in faint candles, to forewarn of a pause or a reversal.
For swing traders: Historically, a strong demand zone is observed around $105,000-$106,000. On the other hand, a huge resistance wall exists around $111,000-$112,000. Whichever side this push-pull battle takes will probably decide Bitcoin’s next big move.
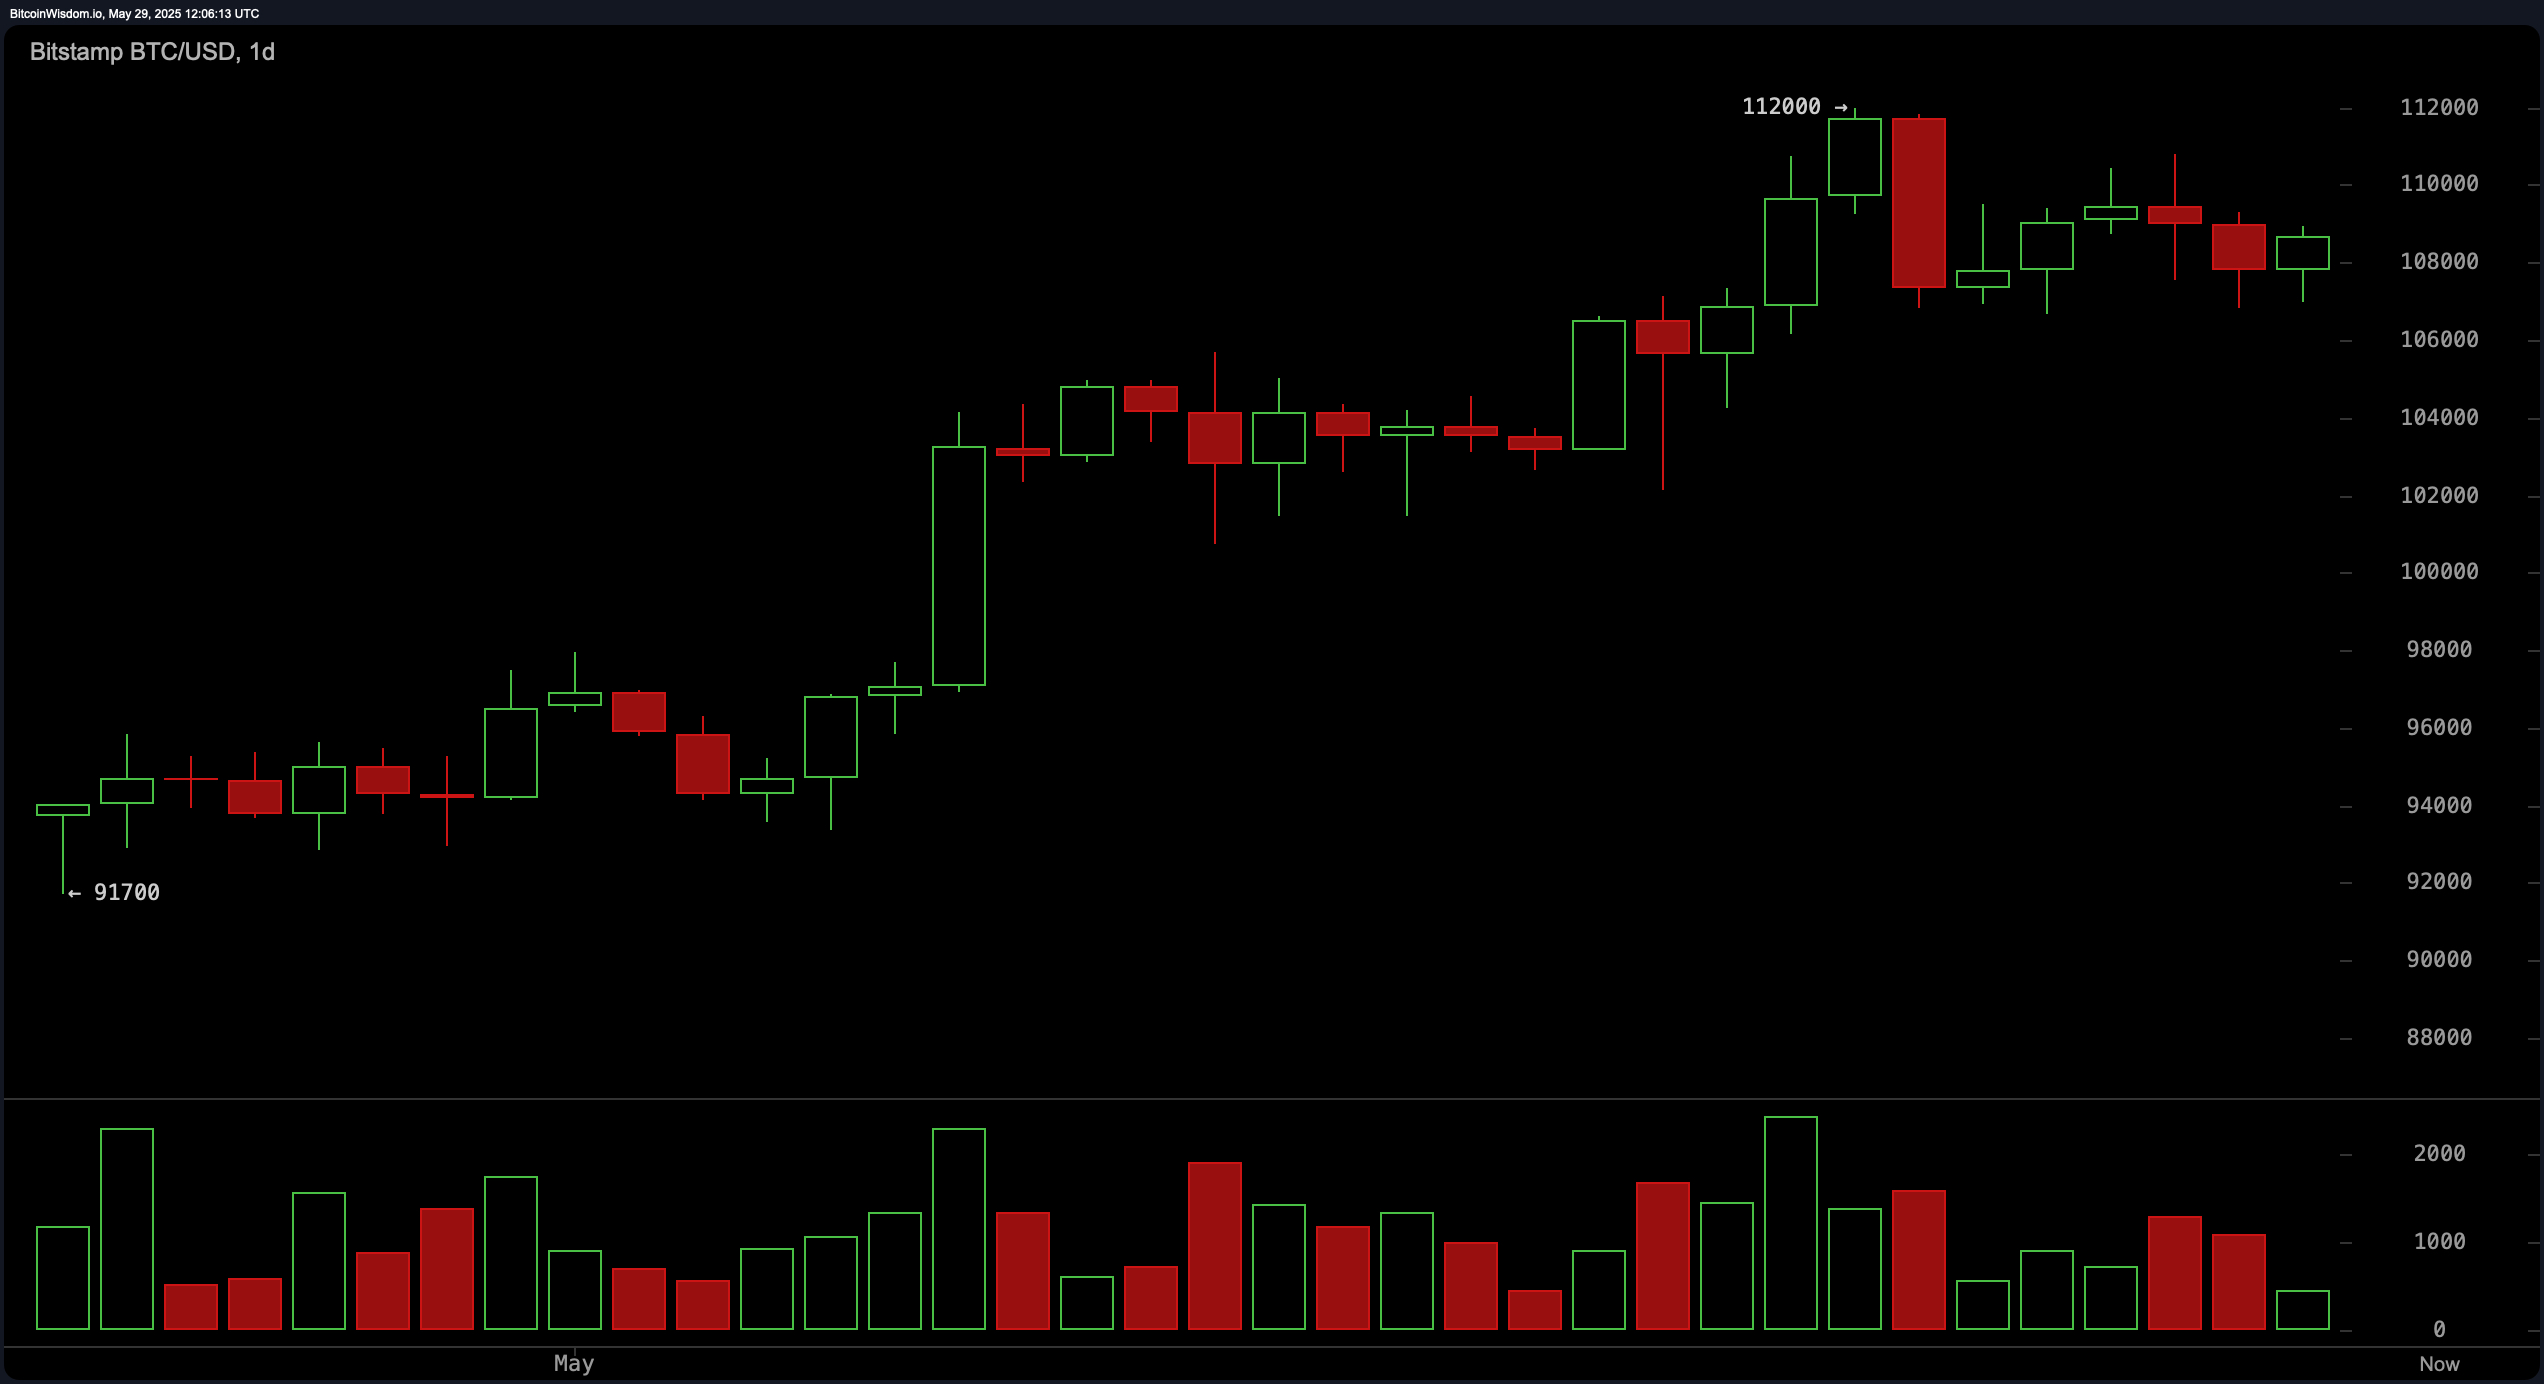
BTC/USD 1-day chart on May 29, 2025.
On a four-hour chart, trading in Bitcoin is very reminiscent of a rollercoaster ride. Once it flirted with the mark of $111,000, it quickly plunged to $106,666 amidst a bullish engulfing pattern suggesting some relief. Yet, the series of lower highs can paint a grim picture. Interested? Watch for dips in the range of $107,000 to $107,500, and exit near $110,000, where sellers were quite aggressive in their attacks. A recent red candle barks “capitulation.” Volume is king; pay attention.
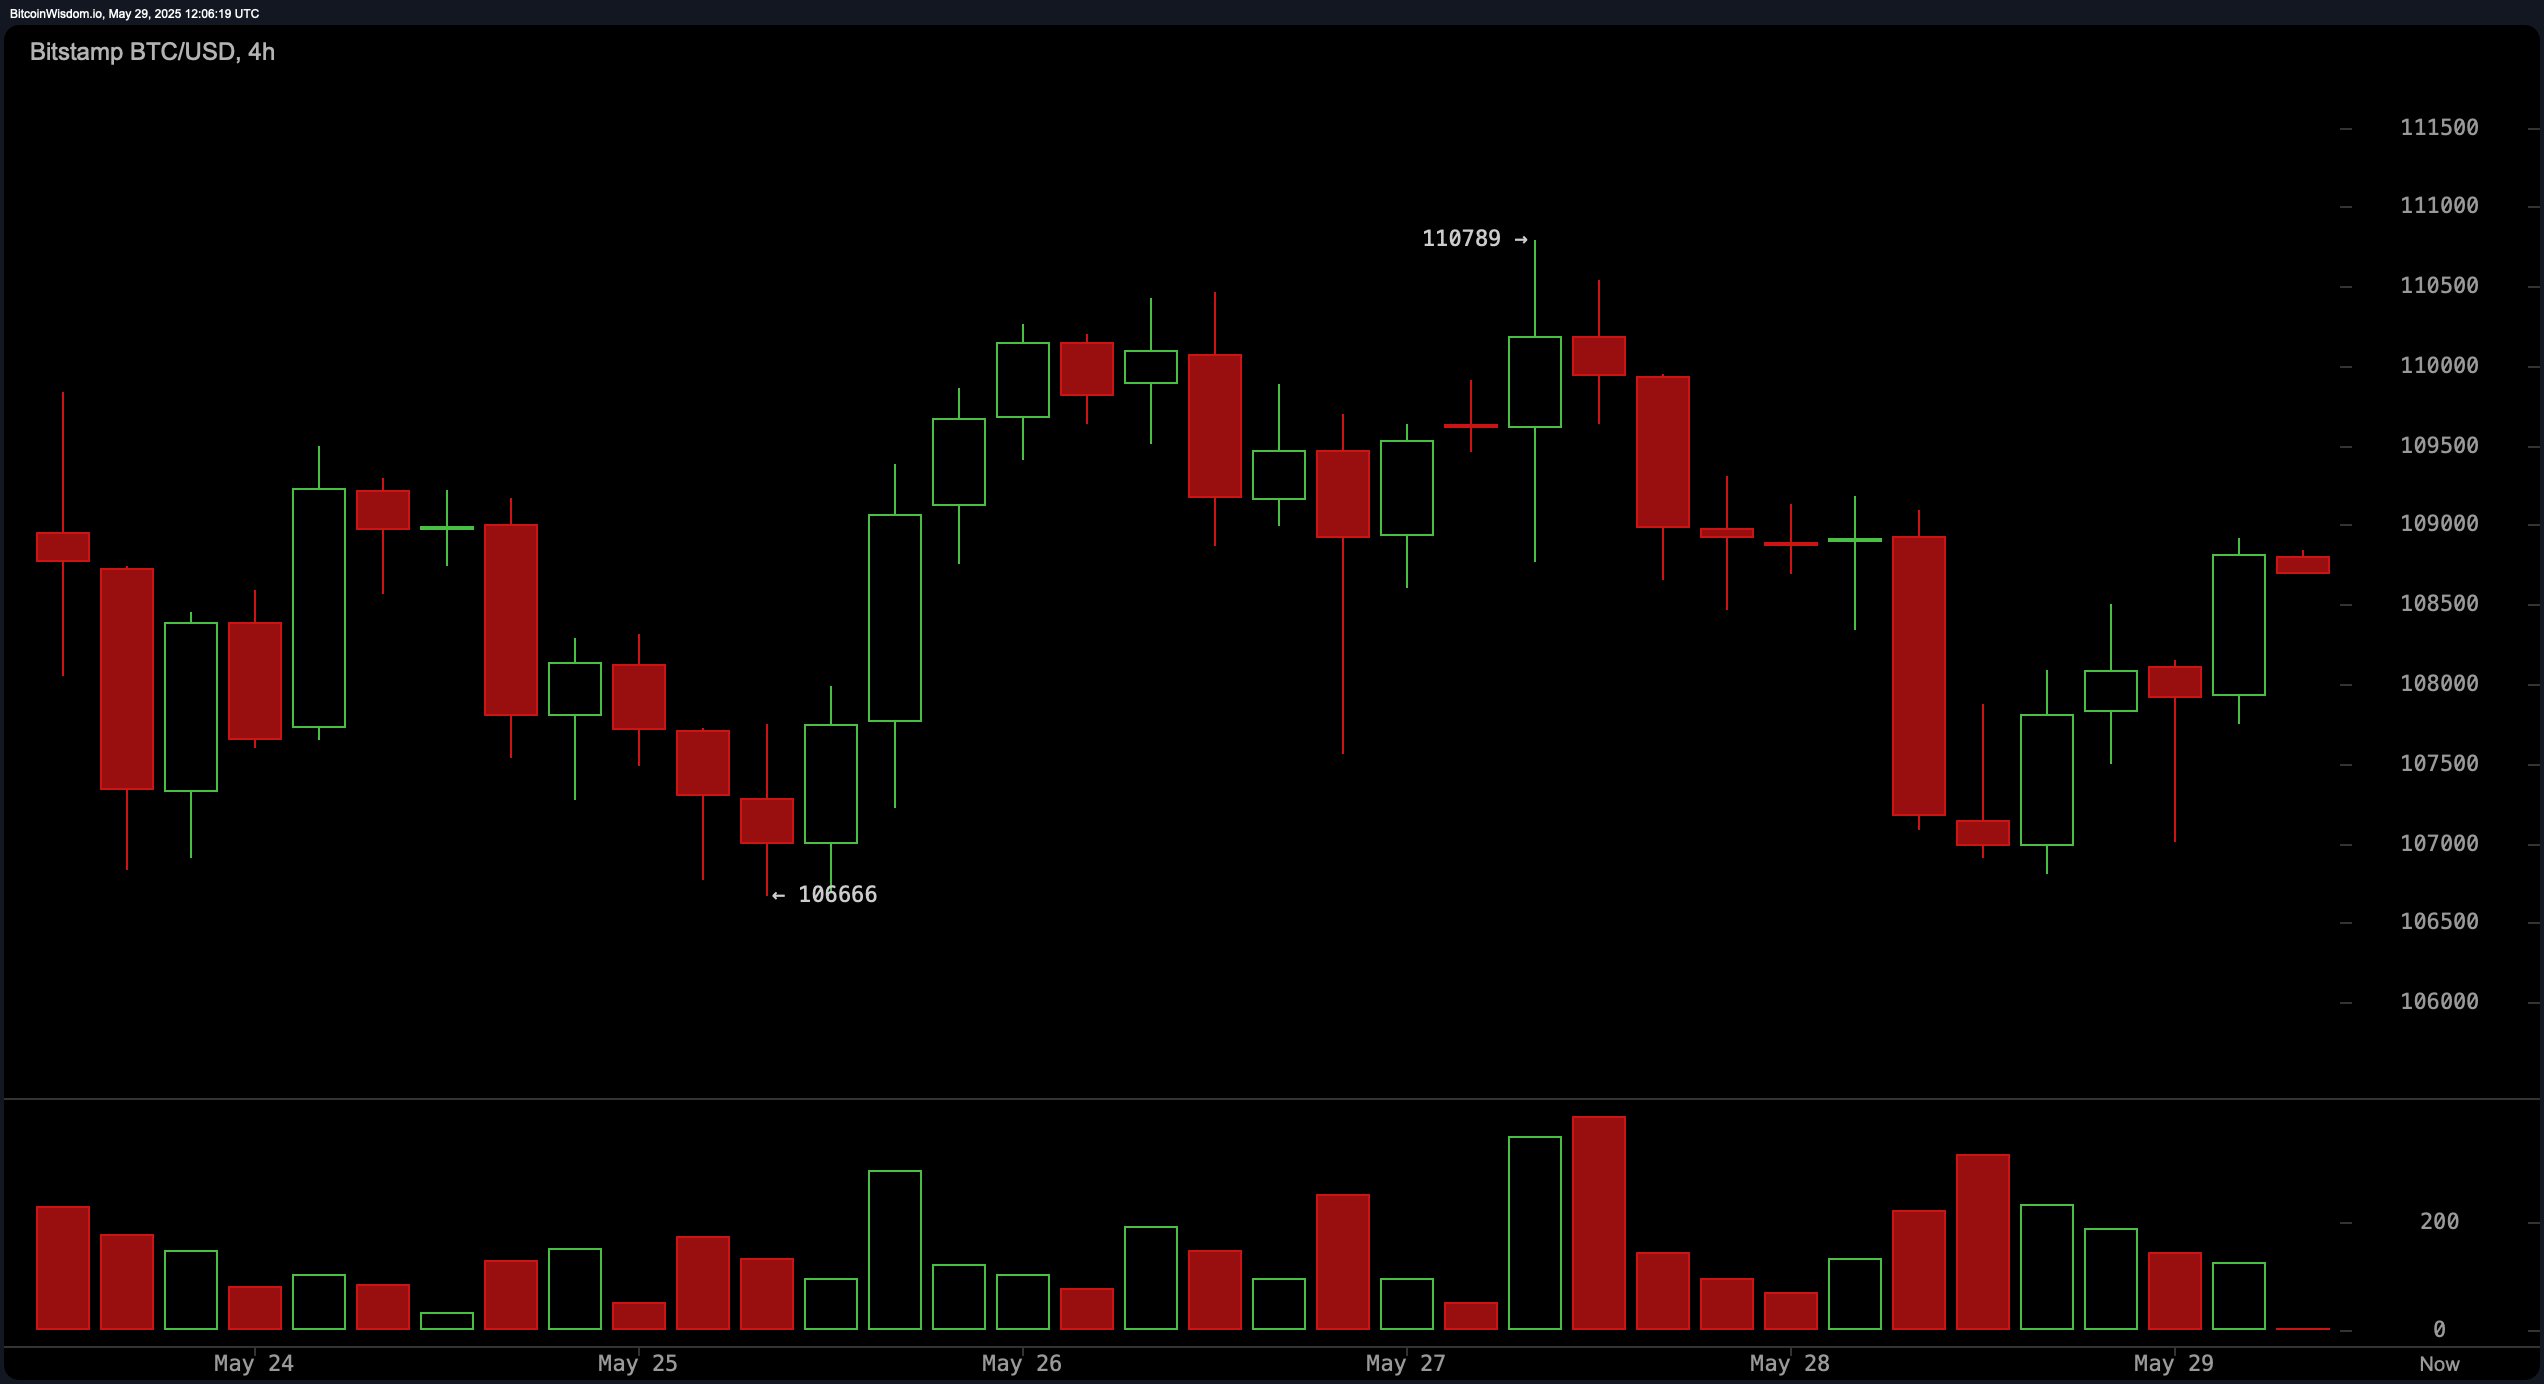
BTC/USD 4-hour chart on May 29, 2025.
The hourly Bitcoin chart paints a dramatic V-rebound, surging from a low of 106,804 to kiss the $109,000 level, bearing the stamp of strong intraday buying pressure. But caution: this move is devoid of volume, hinting at its possibly short-lived gains.
The strategy suggests pitching in at dips into the lows of $107,500. Then, hopefully, in the upward phase, watch for bullish signals such as a hammer on the candlestick to confirm that traction into the bullish phase. The $109,300 barrier, being the former intraday peak, is still quite strong.
Although the momentum is with the bulls right now, the continued uptrend is subject to an impressive surge in volume. Without massive volumes, this recovery shall remain a distant mirage.
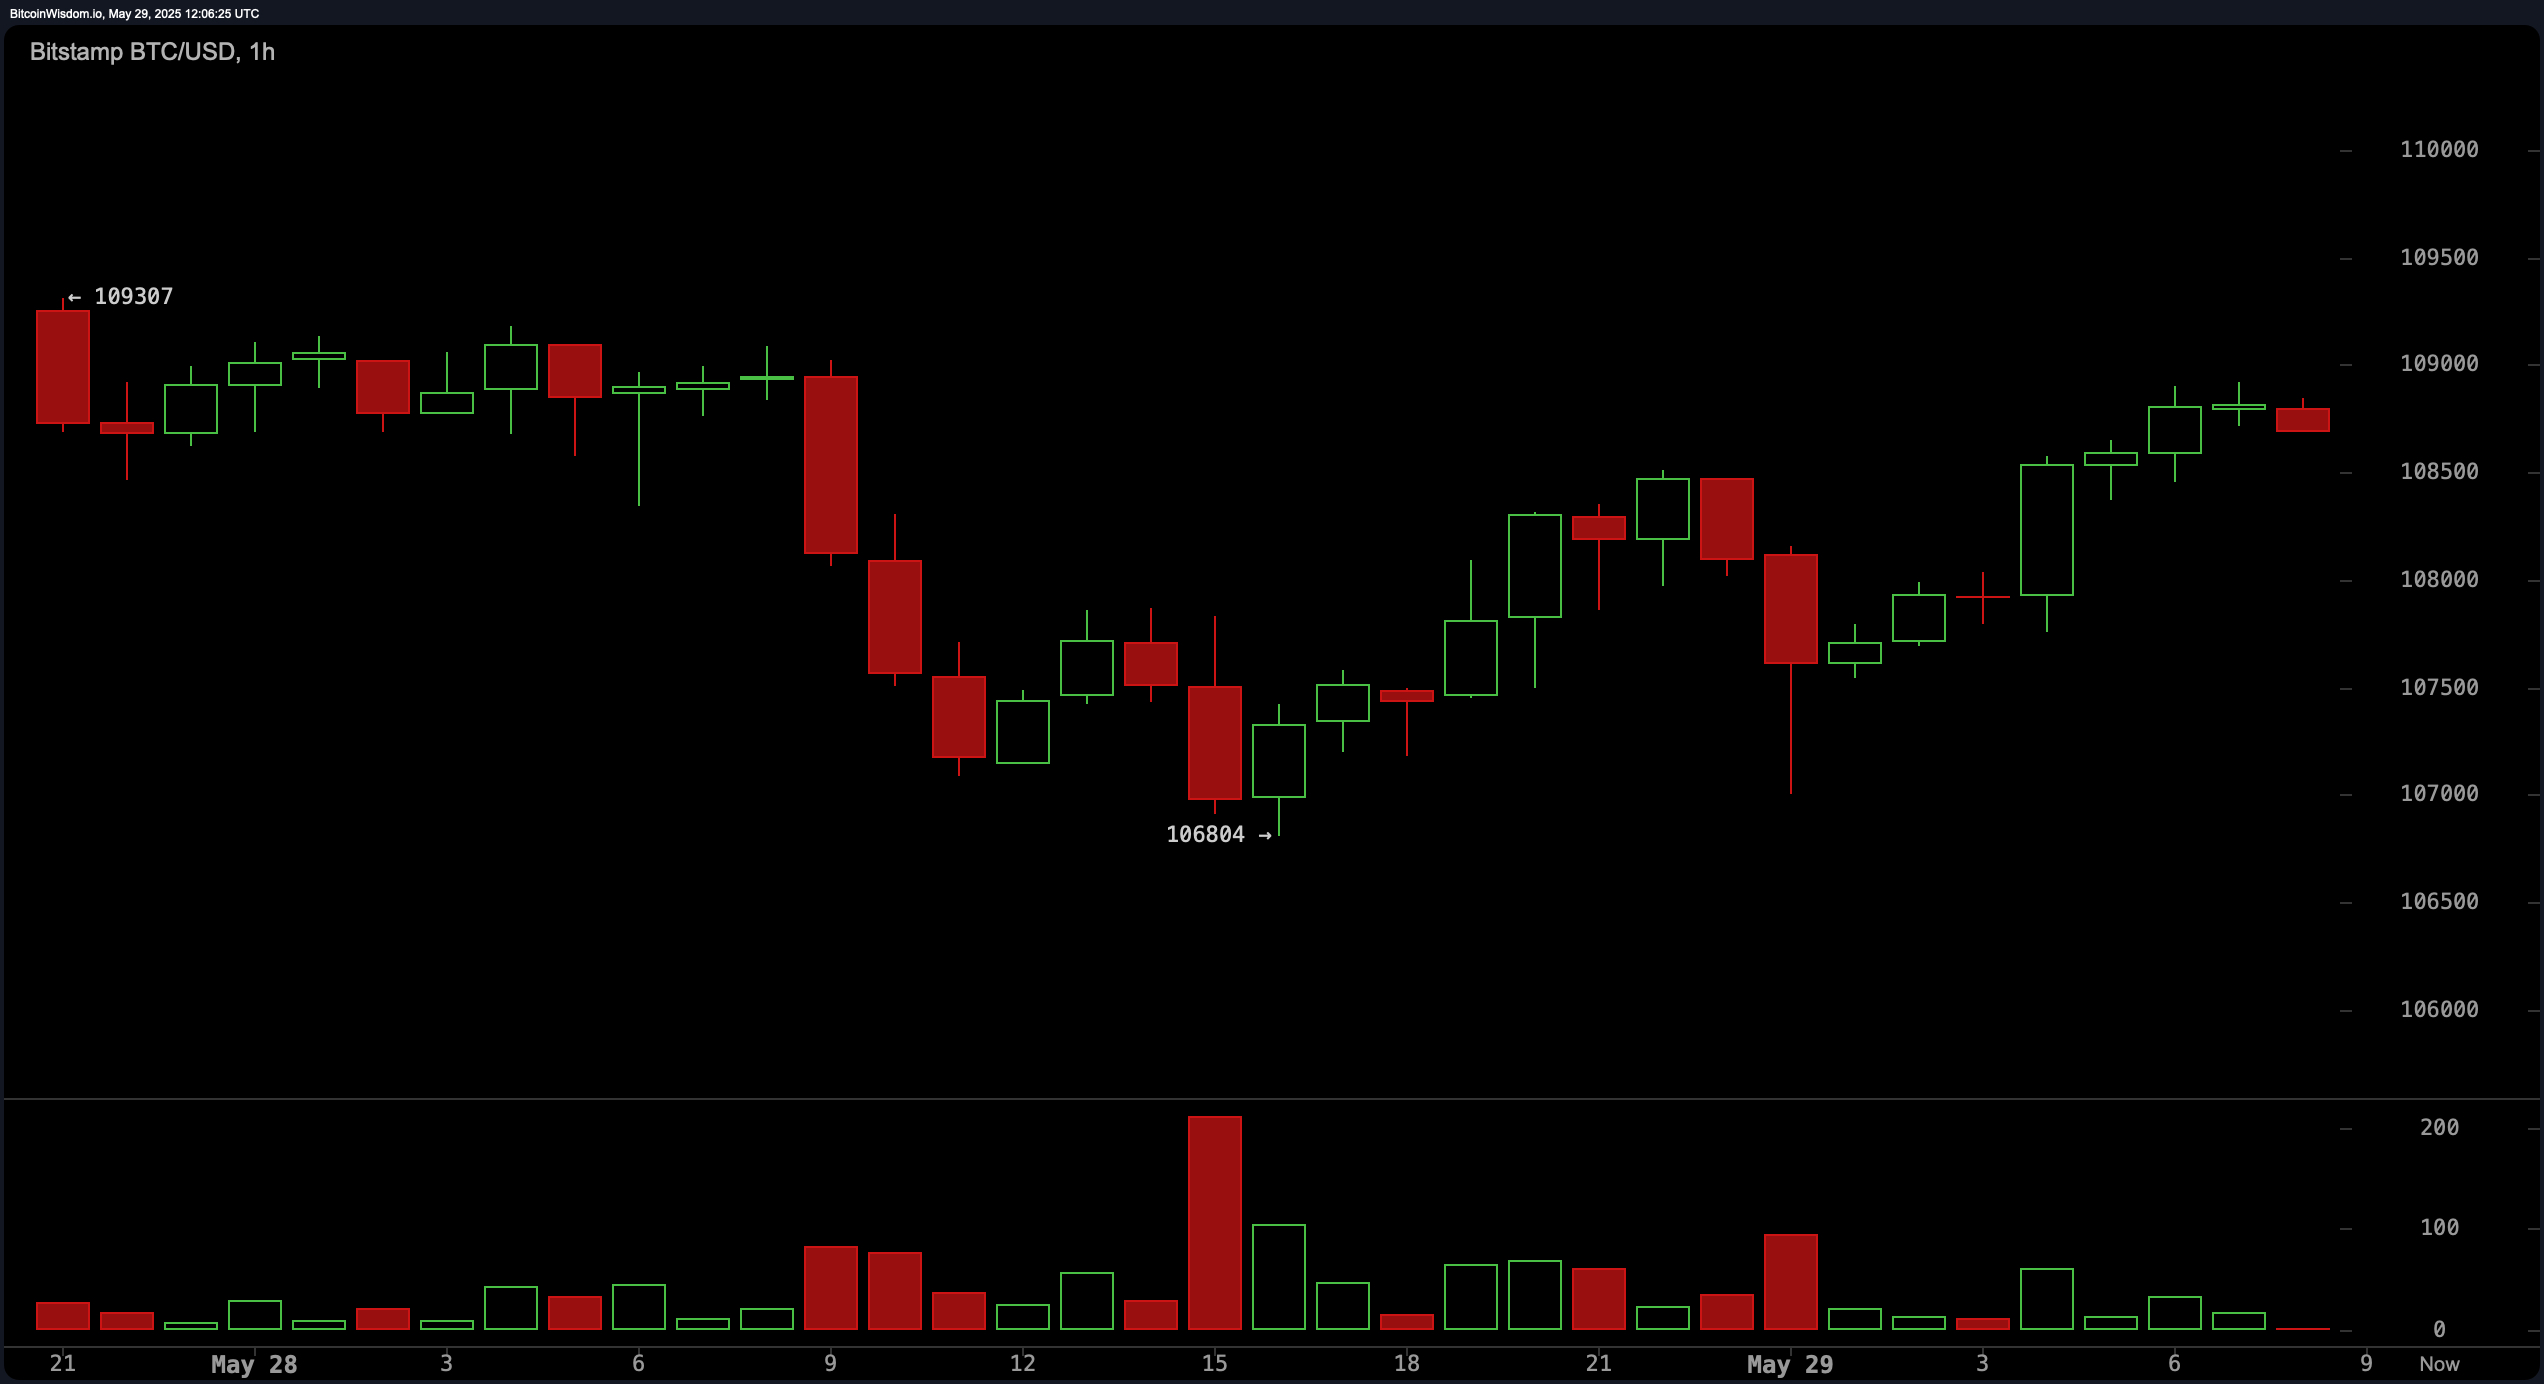
BTC/USD 1-hour chart on May 29, 2025.
On May 29th, we could expect cautious indecision from the oscillator landscape. No contrarian views could bring dramatic swings-the market is holding its breath! The RSI (63), stochastic (66), CCI (56), and ADX (29) quietly say “balance” without darting toward bullish or bearish extremes. Come to think of it, even the Awesome Oscillator, averaging 6,524, casts no well-defined signal.
Looking a bit closer, the cracks in neutrality begin forming. Momentum flashes a hopeful green signal (3,130), a lone bull charging against the tide. Yet the MACD throws a bucket of cold water with its bearish stance (3,261). This divergence–this very exertion of forces–calls for great attention. Do not blindly follow the crowd. Tread carefully. The oscillators are speaking: The eye must discern its meaning.
From the lows on 18 February ($91,700), Bitcoin’s ascent finds itself at a crucial juncture. Fibonacci retracement levels are, in a way, invisible magnets highlighting potential zones of support. Keep an eye on $106,210: a fall from here could easily drag prices to $103,460 and, perhaps, even further down to test the levels at $101,850 and $100,240. On the other hand, the bulls will have to defend the $106,210 level to allow the Bitcoin price to continue higher; if it loses this support, bears will grab hold, drawing Bitcoin much faster down the slope.
As of May 29, bulls are in full force, with the moving averages for all time horizons screaming “UP!” Consider it as a fortress of support rising beneath the current price. The EMAs and SMAs for short terms (10, 20, 30) are green, with the 10-day EMA at 108,017 and SMA at 108,749, respectively. Going long-term at 100 and 200 periods, the scenario doesn’t change: at $95,521 and $94,601, the EMA (100) and SMA (200) have cemented the base beneath the platform. The kicker: as long as Bitcoin boogies above that crucial floor, the uptrend is unbreakable. Consider this your green light–bull market is not only alive, it’s thriving.
Bull Verdict:
Bitcoin is truly coiling like a viper waiting to strike. A series of stepping lows that appear on the charts, backed by major moving averages bellowing in unison, “buy,” reinforce the bullish conclusion. Imagine it as a heavily compressed spring. The critical bottleneck is $107,500. It is here that the bulls have dug in. Clear $109,300 andboom– watch the quick ascent to $112,000 and clear skies above. This isn’t just sitting up; this is taking big strides for a big explosion.
Bear Verdict:
While the bitcoin express seems to be sputtering, it has not stopped climbing. Cracks are emerging: volumes are fading during rallies, MACD is flashing a sell warning, and RSI is struggling to breathe. What is the magic number to watch? $106,000. A decisive plunge below this could set loose a cascade with bitcoin crashing towards $103,000, maybe even $101,000, destroying recent fortunes, handing the reins to the bears.
Final Verdict:
Bitcoin is making a climb up on the knife’s edge. Will it finally break the key support and get pasted, or will it break through this time from above? The bulls are all in, acting on the hopes that key support holds and moving averages turn bullish once again. And there come the dark clouds as momentum now begins to fade. Will Bitcoin go berserk toward the $106K target or shall the bears prevail now? The really smart traders now strap on their seat belts with every stop-loss tied up in position, prepared for anything. This does not hold any fun for heart malingers.
Thanks for reading Bitcoin Price Watch: Mixed Signals From MACD and RSI Suggest a Critical Juncture
 Ethereum (ETH) and XRP!")
