Related Articles


Bitcoin’s heartbeat today: a hesitant drum solo. The crypto king, fresh off a rollercoaster ride of plummeting lows and defiant rebounds, now hovers, suspended between a bullish fanfare and a bearish growl. The arena holds its breath, waiting to see which beast roars first.
Bitcoin Chart Outlook
Bitcoin claws its way back from the abyss! After a gut-wrenching tumble to $80,537, the king of crypto is staging a dramatic resurgence, now teetering above $90K. Forget doom and gloom – the charts are screaming “recovery!” A classic falling wedge breakout has ignited a fire under Bitcoin, fueled by a surge of trading volume that’s got analysts buzzing. Is this the start of a legendary bull run or just a temporary reprieve?
This surge of activity at market lows isn’t just noise – it’s a symphony of accumulation, amplified by the volume. Chart-watchers, take note: the wedge has broken. Could this be the runway to a $94,000–$96,000 launch? One wrong step below $80,500, however, and the champagne goes back on ice.

BTC/USD 1-day chart via Bitstamp on Nov. 29, 2025.
Zooming in on the 4-hour chart, Bitcoin’s tale twists. A bullish surge from $85,225 to $93,091 now feels like a distant memory as Bitcoin idles in a tight corridor. Picture this: a tense standoff between $90,000 and $91,500, like a coiled spring waiting to unleash. Resistance at $93K acts as a stubborn ceiling, while dwindling trade volume hints at a tired bull run. To reignite the upward momentum, Bitcoin needs a decisive break above $93,100, otherwise, it’s just market static. But beware: a fall below $89,500 could open the floodgates to a bearish downturn.
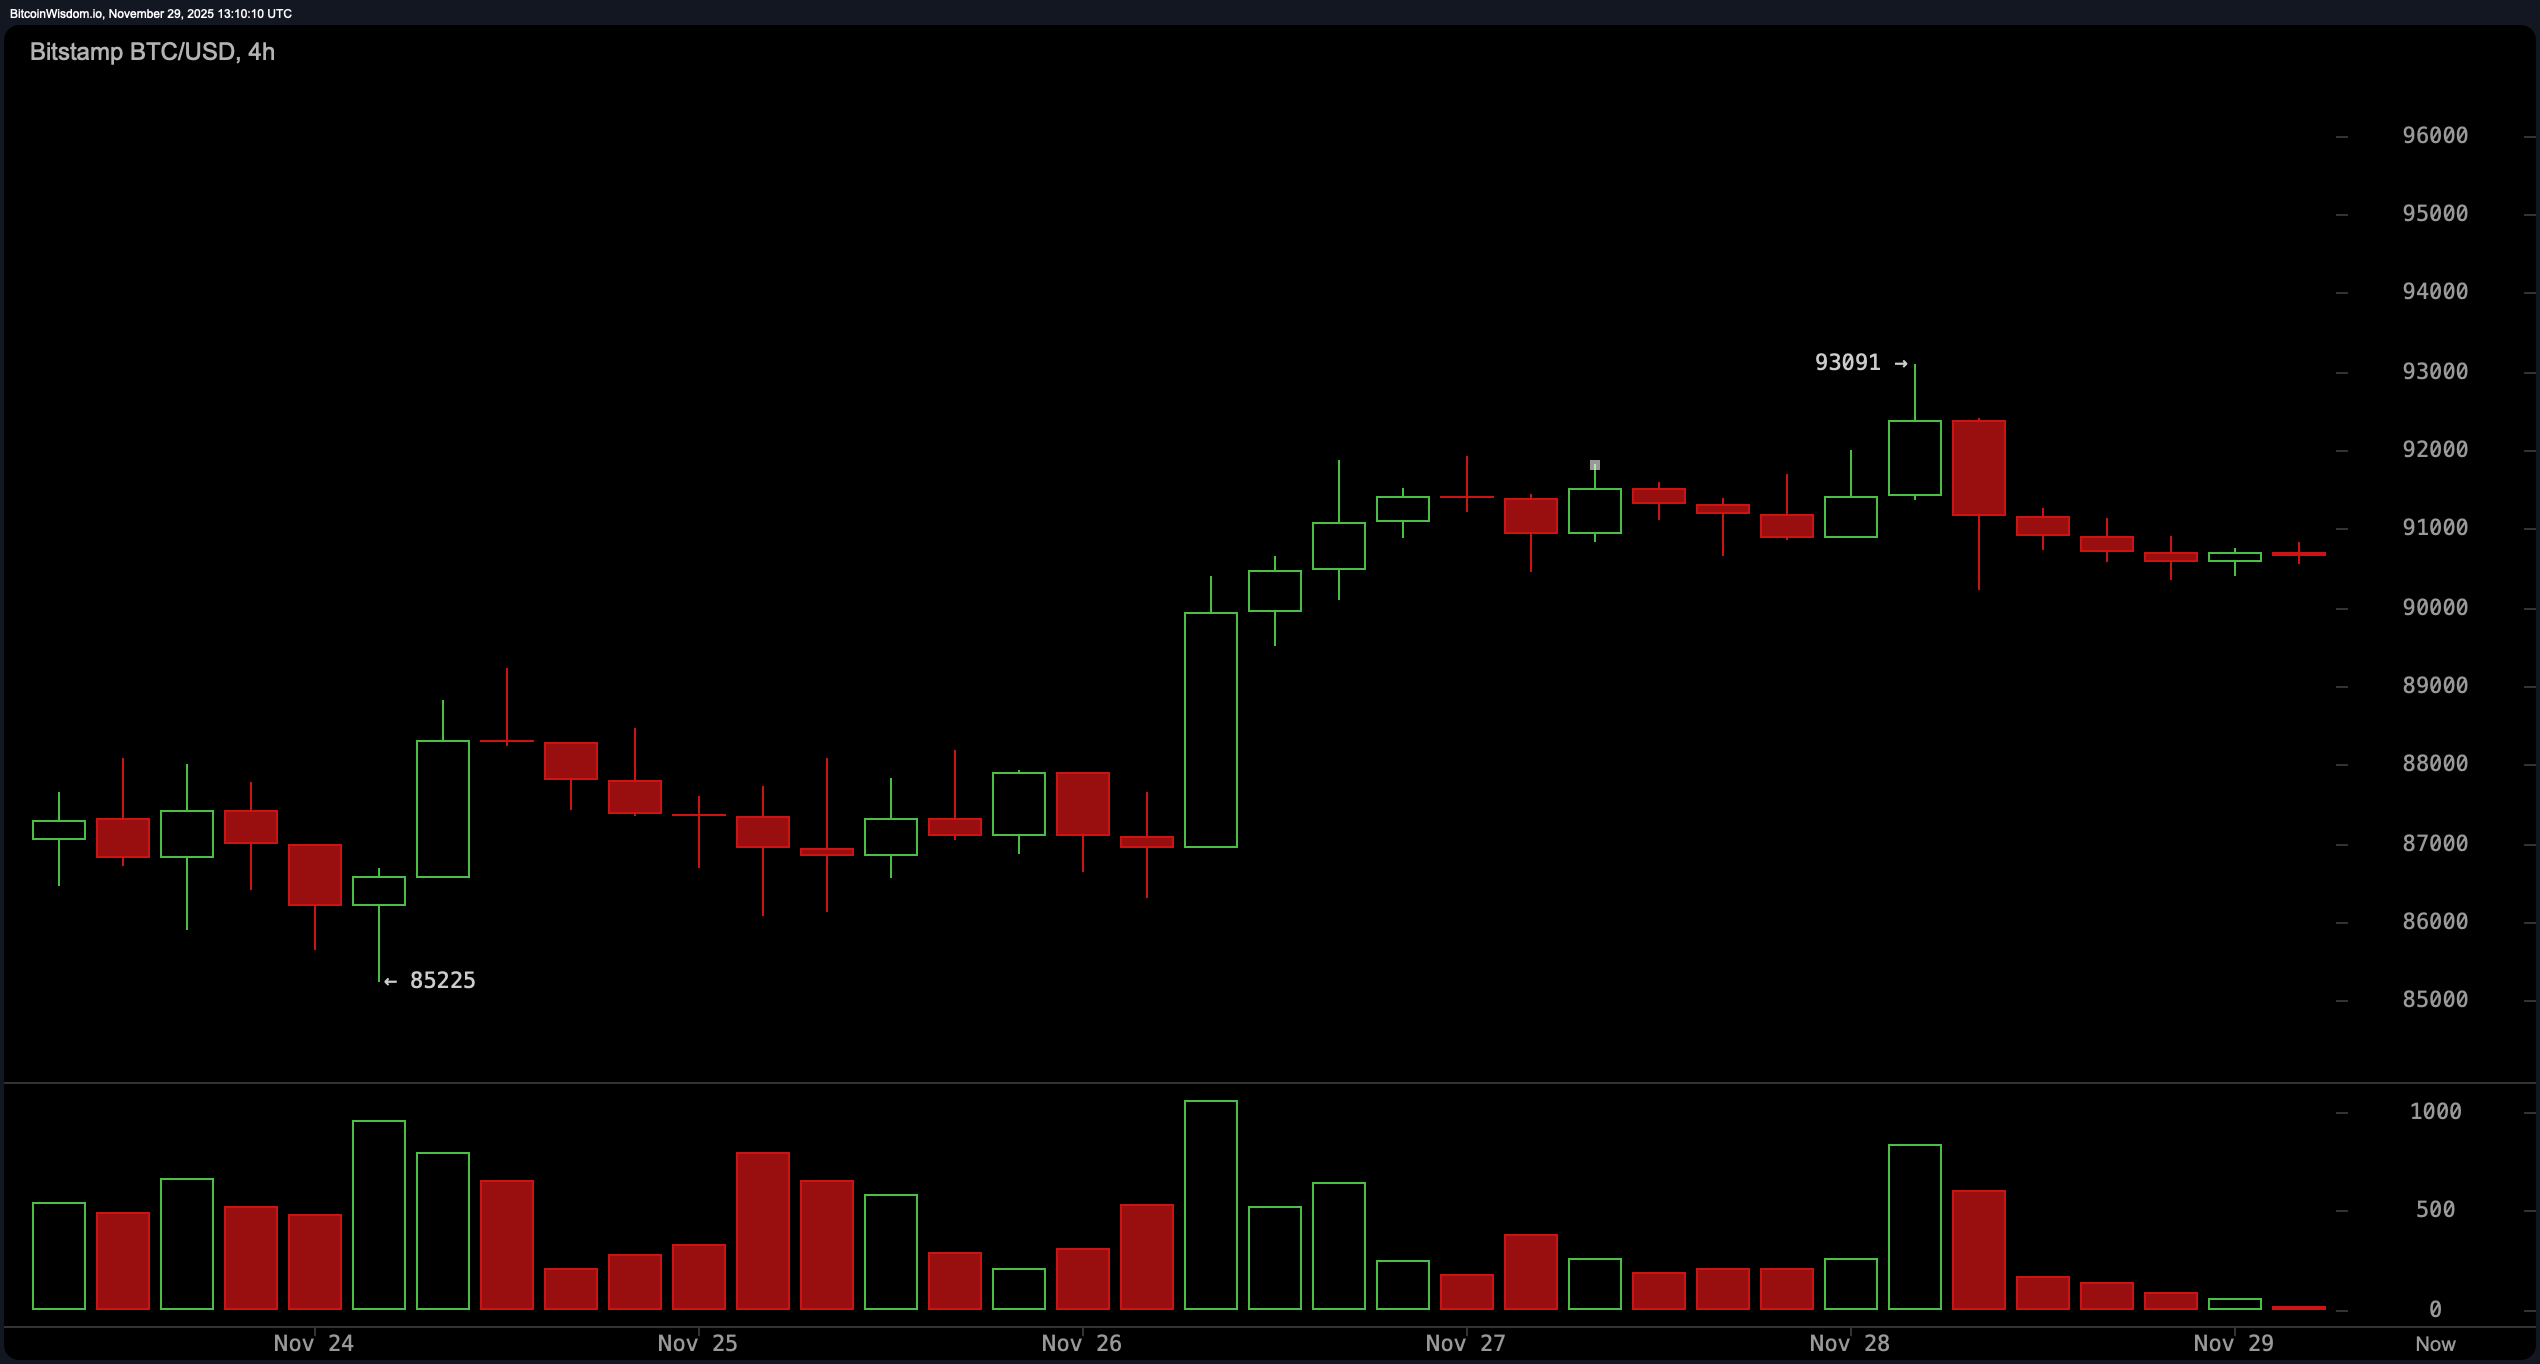
BTC/USD 4-hour chart via Bitstamp on Nov. 29, 2025.
Zooming into the 1-hour chart, the plot thickens. Bitcoin nose-dived from $93,091 to $90,233, only to be caught in a standstill between $90,500 and $91,000. With trading volume quieter than a graveyard at midnight, Bitcoin is clearly holding its breath, waiting for a spark. Scalpers, sharpen your blades: the $90,200–$90,300 range might offer a quick hit. But beware, a fall through the $90K trapdoor could send us spiraling back to $89,000… or lower.

BTC/USD 1-hour chart via Bitstamp on Nov. 29, 2025.
Oscillators are in a holding pattern, offering little in the way of actionable signals. The RSI is idling at 40, the Stochastic indicator is humming along at 61, and the CCI is stuck in neutral at -28. The ADX, flexing its muscles at 41, suggests underlying trend strength, but stubbornly refuses to pick a direction. The Awesome Oscillator is barely a whisper at -8,996, and momentum has taken a nosedive to -803. Only the MACD, registering -4,053, hints at a potential bullish revival.
Moving averages paint a starkly divided picture. While the swift 10-period EMA ($90,265) and SMA ($88,206) whisper promises of support beneath the current price, a formidable wall of resistance looms overhead. From the 20-period all the way to the 200-period SMA, these averages stand guard, a stark reminder of the challenges ahead. The 200-period SMA, a distant $109,796, serves as a particularly imposing sentinel, underscoring the significant longer-term headwinds at play.
Bitcoin’s story hangs in the balance, a comeback whispered but not yet shouted. The price charts are a gauntlet: conquer $93,100 with force, and the bulls charge anew. Stumble below $89,500, and winter returns. Until then, hold your breath and your Bitcoin.
Bull Verdict:
Bitcoin teeters on a knife’s edge. Shatter the $93,100 ceiling with decisive force, and the bulls seize control, roaring towards a $94,000-$96,000 target. The daily chart’s falling wedge breakout whispers of renewed momentum, paving a tantalizing highway upward – if, and only if, Bitcoin navigates the treacherous resistance lurking ahead.
Bear Verdict:
Losing the $89,500 line in the sand isn’t just a stumble it’s a potential freefall. Brace for impact: $86,000 is the first stop, but the ride could get rough all the way back to the $80,500 launchpad. With looming moving averages and silent oscillators, Bitcoin might need a brutal wake-up call before its next breakout attempt.
FAQ ❓
- Where is bitcoin’s key resistance level now?The primary resistance sits near $93,100, a breakout point watched globally.**
- What price level could trigger further downside?A drop below $89,500 could lead to renewed bearish pressure across markets.**
- Why is volume important in bitcoin’s current range?Low volume signals indecision, making breakouts or breakdowns less reliable without confirmation.**
- Is this a good time to trade bitcoin locally?Regional traders should monitor the $90,000–$91,500 band for short-term volatility cues.**
Thanks for reading Bitcoin Price Watch: Volume Fades but a Breakout Still Beckons

