Related Articles

BNB’s price is caught in a tug-of-war, but on-chain whispers suggest a breakout is brewing. Spiking user engagement and subtle whale movements are flashing signals – could the stalemate soon shatter, catapulting BNB into a new rally, provided the market winds blow in its favor?
Active Address Count is Back on the Rise
BNB’s network is buzzing! Forget the spring slump – active addresses have been on a thrilling ascent since May. What began as a recovery exploded into a full-blown rally, culminating in a peak of over 1.75 million daily addresses on June 20th. The BNB chain is heating up, and everyone wants a piece of the action.
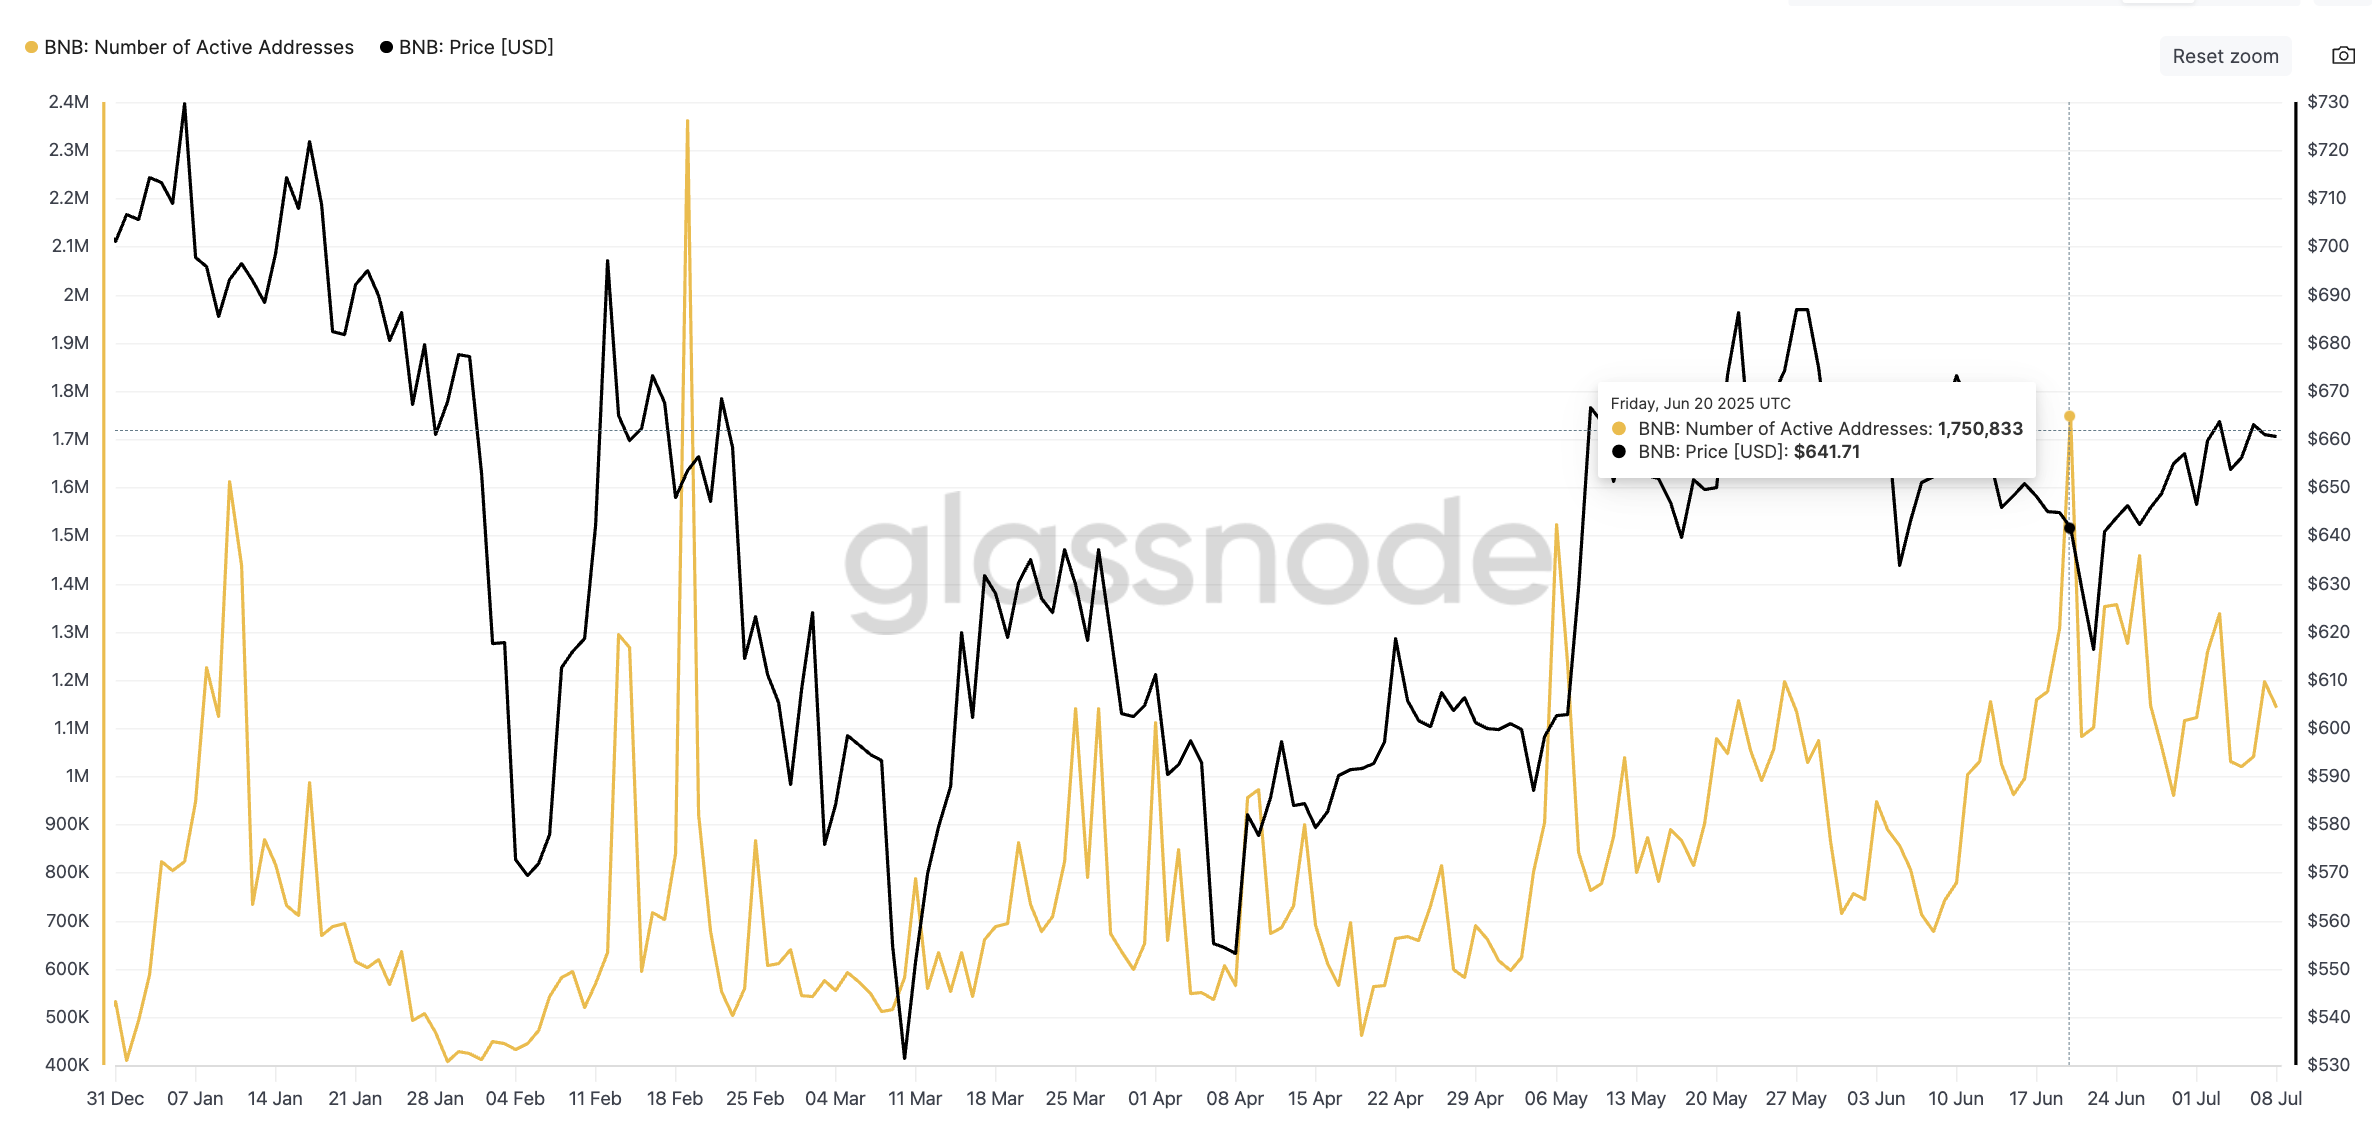
BNB price and rising active address count: Glassnode
Forget fleeting pumps. The surge in active addresses isn’t just a blip on the radar it’s the heartbeat of genuine interest. This organic groundswell lays the foundation for lasting rallies, proving this consolidation isn’t a mirage, but a movement quietly gaining momentum beneath the surface.
Top 1% Wallet Spike Hints at Quiet Accumulation
Glassnode’s on-chain analysis has revealed an anomaly: a rare double spike in BNB ownership concentration. The top 1% of addresses holding BNB witnessed not one, but two significant surges in their collective holdings on June 21st and June 28th. This unprecedented pattern is the only instance of such concentrated accumulation observed throughout 2025.
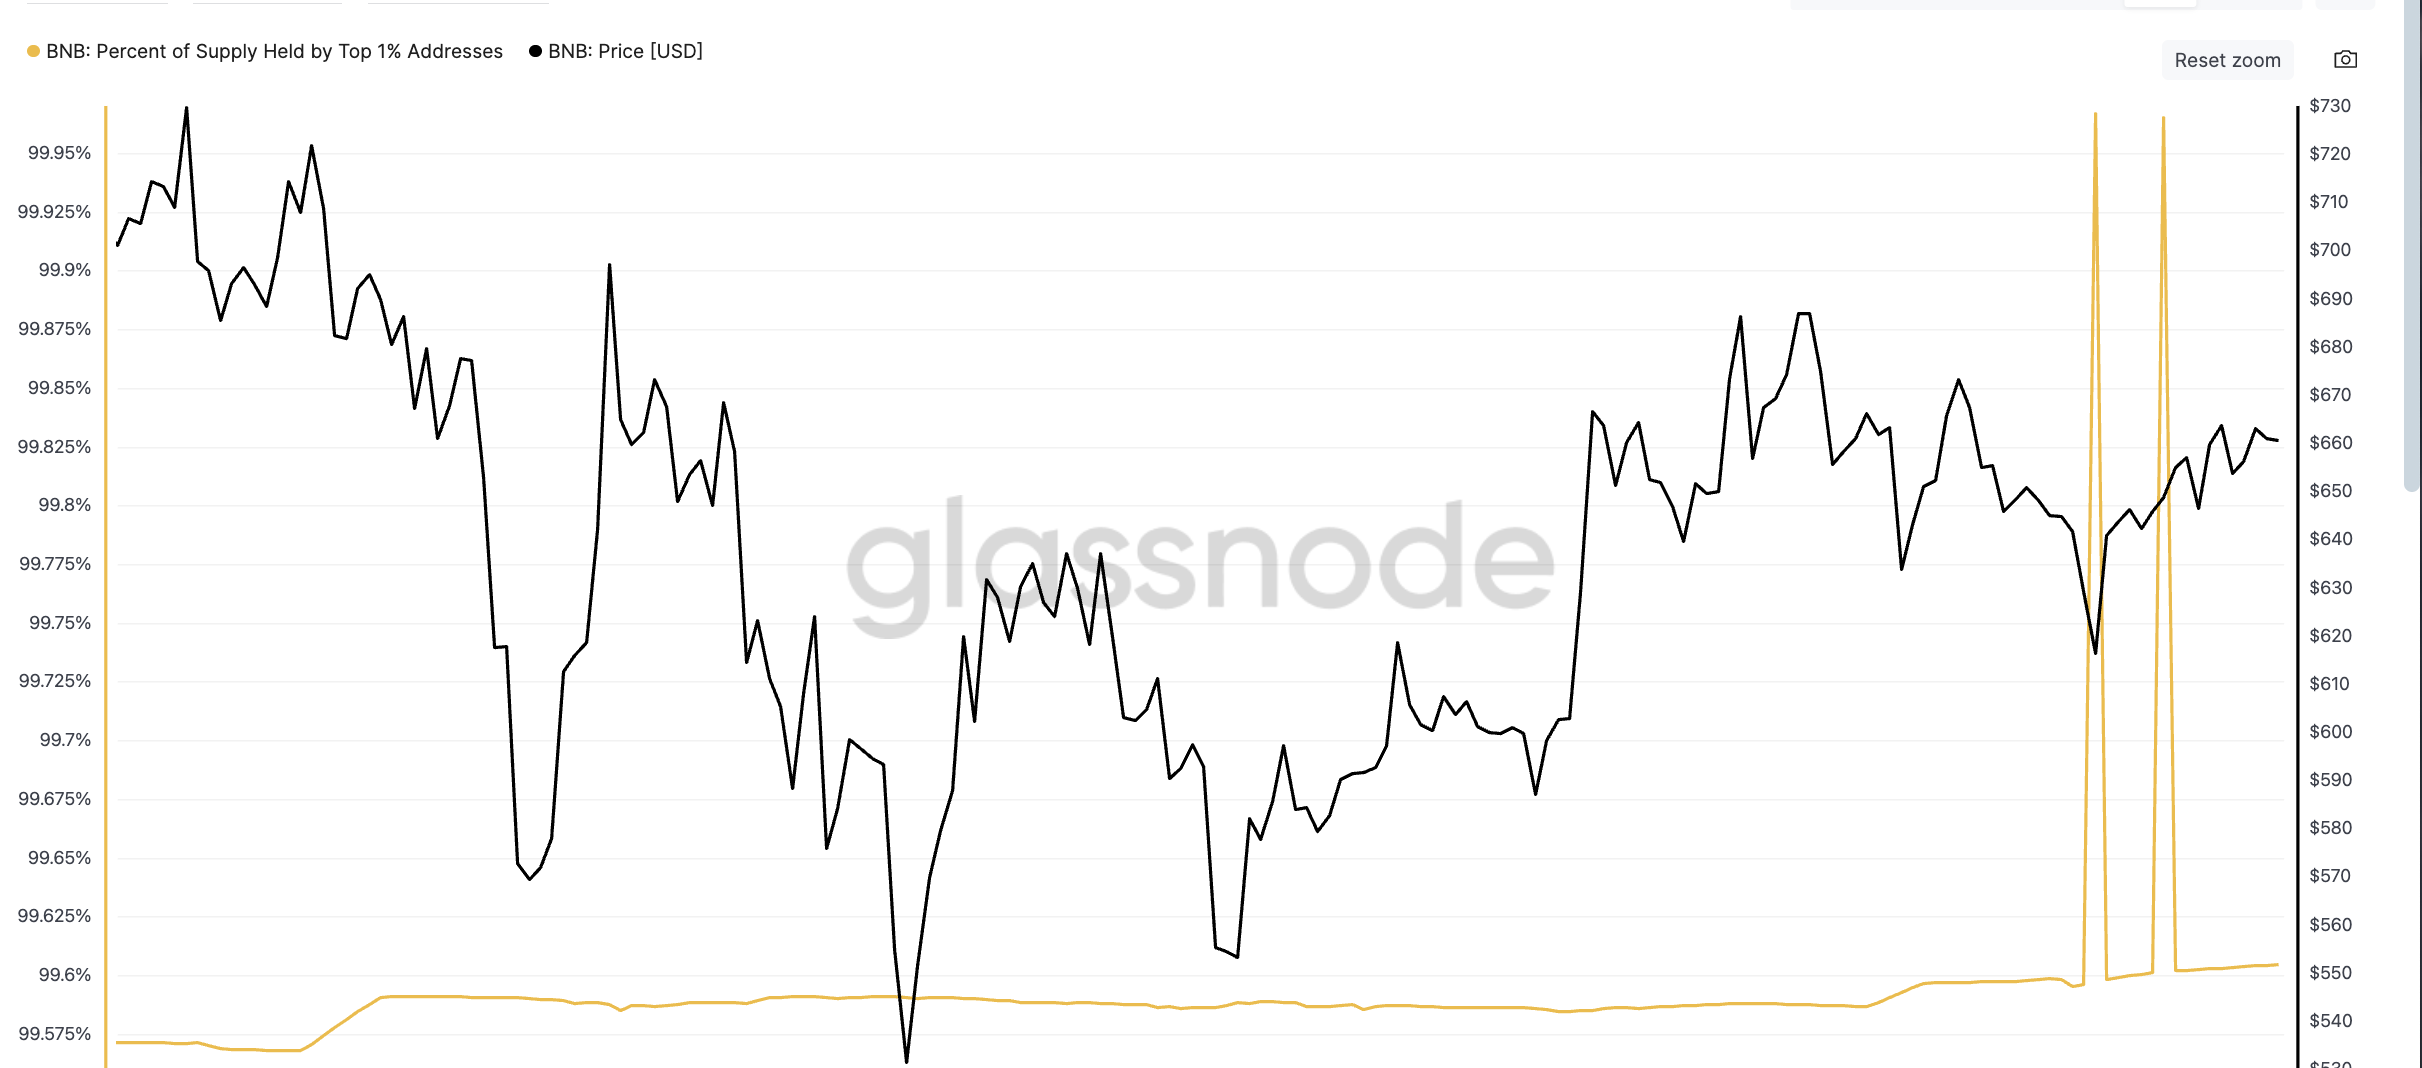
BNB price and spikes in Top 1% supply-held addresses: Glassnode
The crypto elite, the 1% – whales and institutions – had been slumbering for months. Then, a tremor: significant shifts in their holdings. Are these silent, over-the-counter deals unfolding in the dark? Or a strategic redistribution of assets? Unlike the frenzied retail investor, these titans don’t hunt pumps. They patiently accumulate during periods of calm, a tactic perfectly mirrored by BNB’s current tranquil price landscape. This could be the quiet before the storm.
Is the BNB whale watch on? Keep an eye on the “top 1%” metric – it’s your early warning system. A sudden surge in BNB hoarded by the biggest wallets? That’s the signal. Sustained accumulation by these crypto titans often hints at an impending price surge.
Ascending Triangle Pattern and RSI Divergence in Motion
On the daily chart, BNB continues to respect an ascending triangle pattern, with strong horizontal resistance at $665–$693.
BNB is coiled like a spring, hovering just beneath the $665 mark. This price point is proving to be a formidable barrier, a line in the sand. Should BNB successfully vault over this resistance, expect a surge – a pattern breakout poised to unleash its potential. Keep a close watch; the longer it dances near $661, the more explosive the eventual move could be,ifthe current structure holds firm.
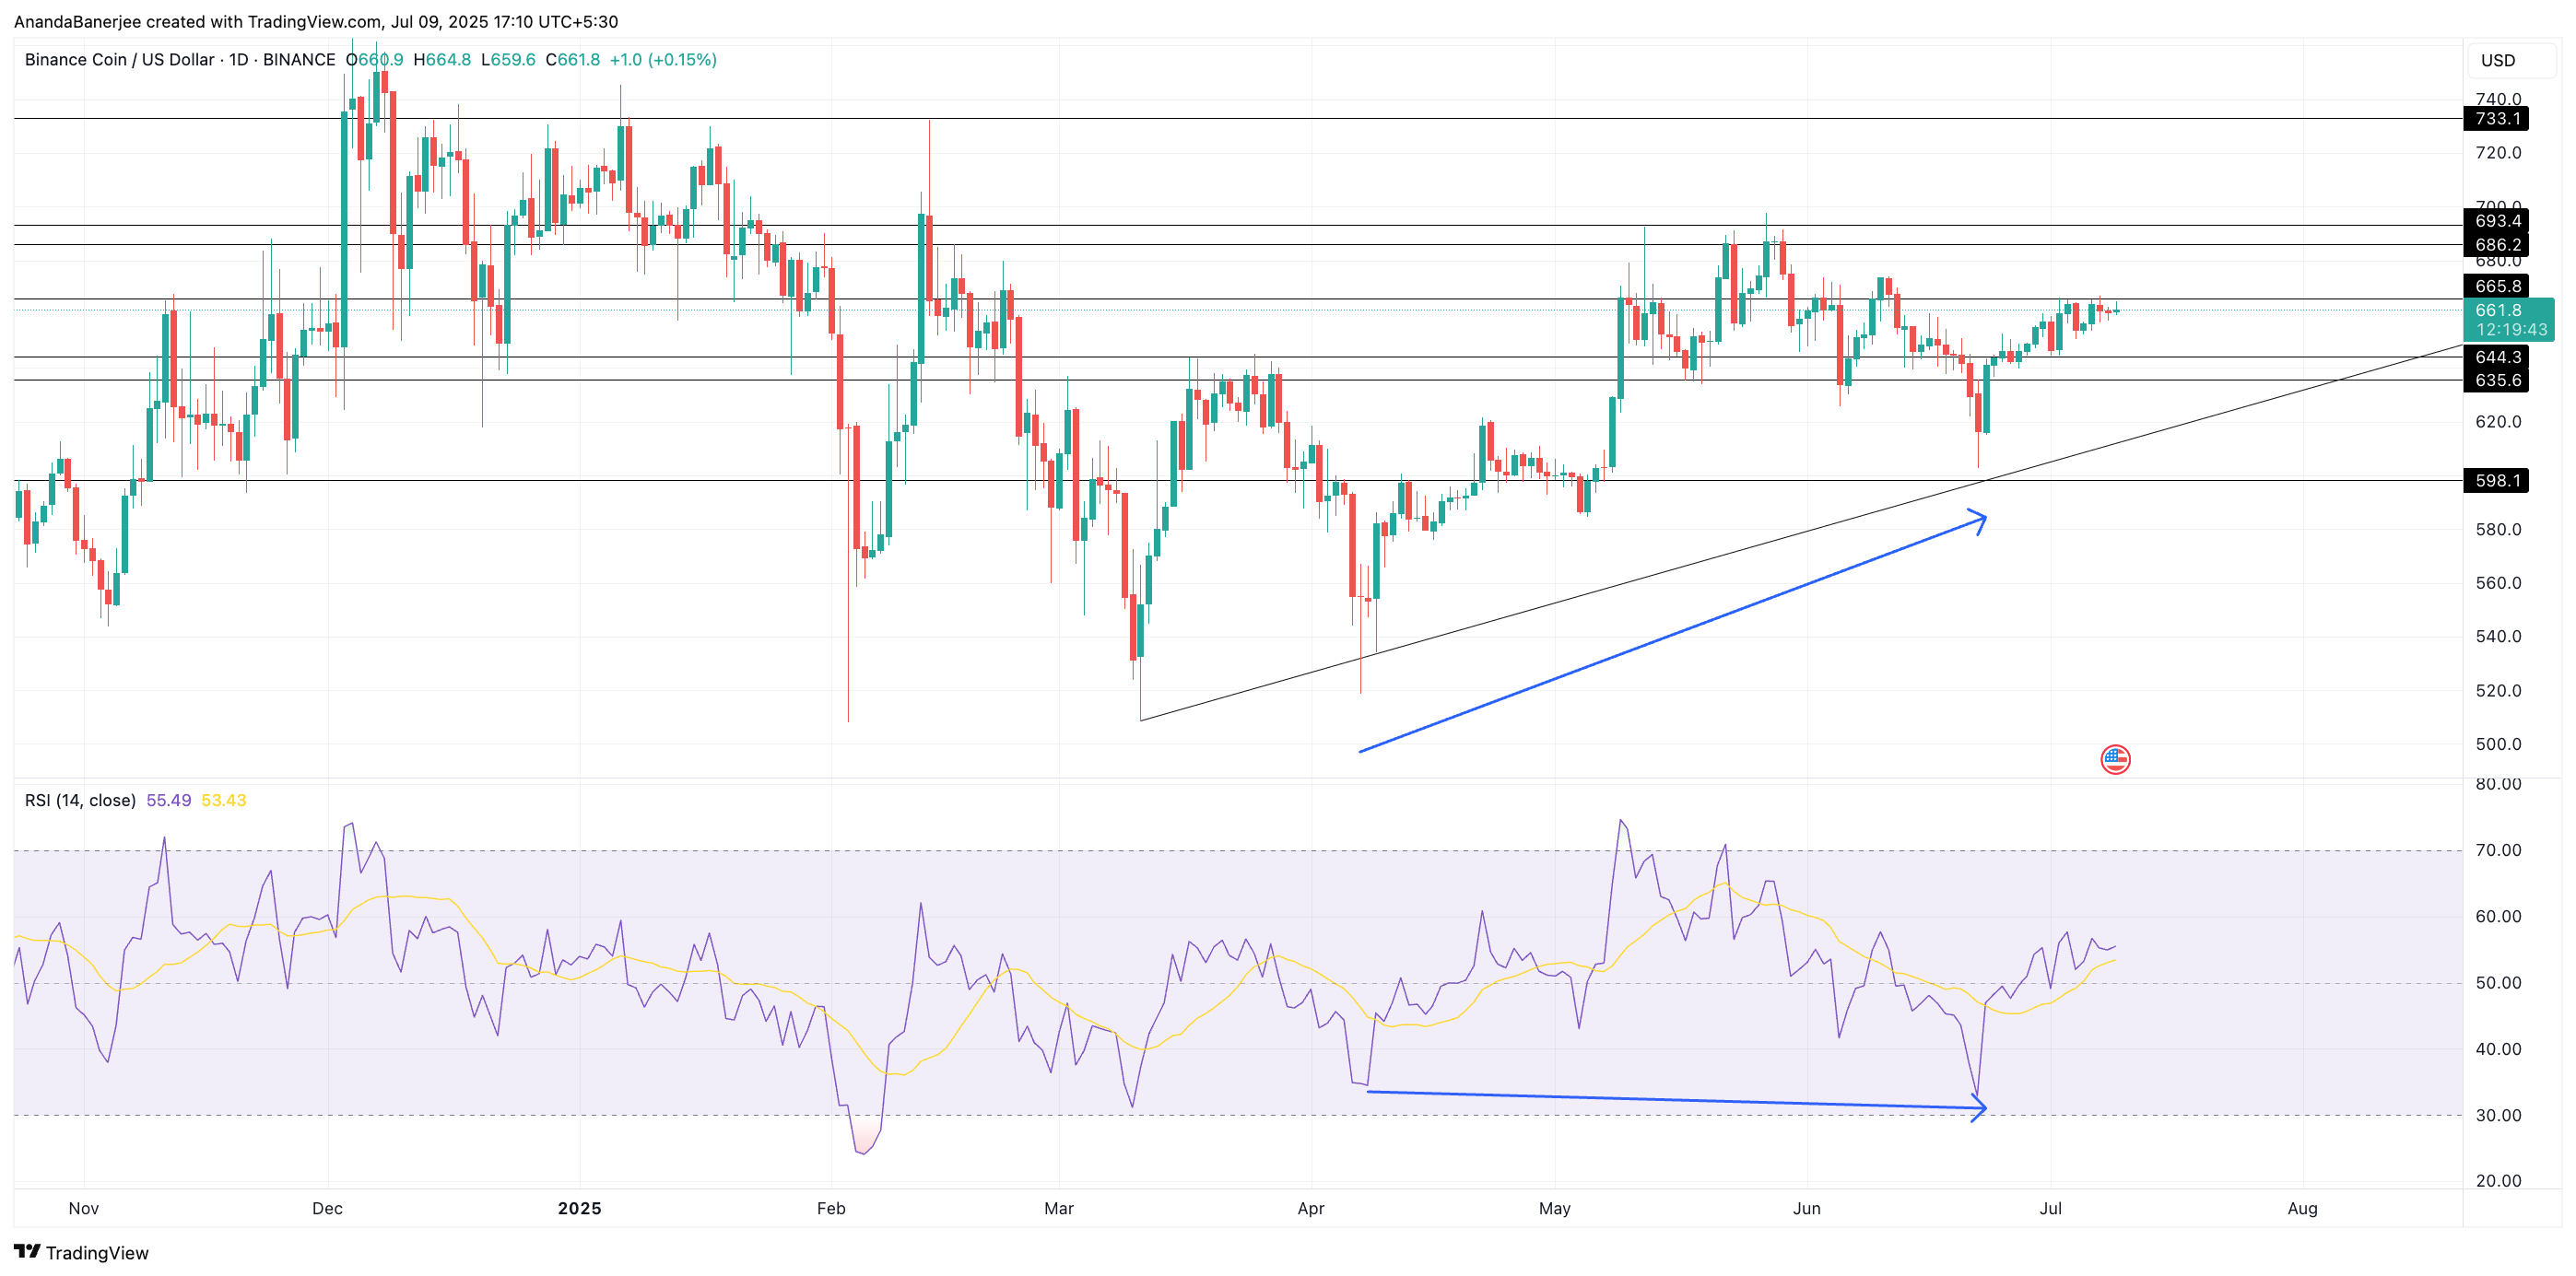
BNB price analysis: TradingView
But here’s the catch: BNB’s upward climb faces a formidable challenge. The ascending triangle pattern, defined by a broad upper trendline forged from numerous support and resistance skirmishes, demands more than just a simple breakthrough. Now, things get intriguing. Between April 7th and June 22nd, while BNB carved a path of higher lows, the Relative Strength Index (RSI) painted a contrasting picture of lower lows – a textbook bullish divergence, hinting at underlying strength ready to explode.
But beneath the surface calm, a tremor runs through the bears. Though BNB’s price clings to its level, a hidden divergence whispers of fading bearish power. The RSI, now flexing upward, confirms the ascending triangle, fueling breakout hopes. Should the bulls maintain their grip and volume surge, BNB could rocket towards $686, then $696, with the ultimate prize – the $733 ceiling – looming large.
$635: The bulls’ last stand. Breach it, and the meticulously crafted triangle pattern crumbles, the bullish RSI divergence evaporates, and the party’s officially over. Expect a mass exodus of active addresses, whales bailing ship, and a freefall into the abyss. This isn’t just a support level; it’s the cliff’s edge.
Thanks for reading BNB Price Range-Bound for Weeks: Will Divergence Change That?

