Related Articles

Bitcoin Breaks Records: $118,423 New ATH Confirmed
Hold on to your hats, crypto fans! Bitcoin just didn’t break the record books; it obliterated them! As of July 11, 2025, $BTC is trading at a mindblowing$118,423, shattering its previous alltime high. Forget champagne; this calls for a rocket launch! Is this the dawn of a new era for digital gold? Buckle up; things are about to get wild.
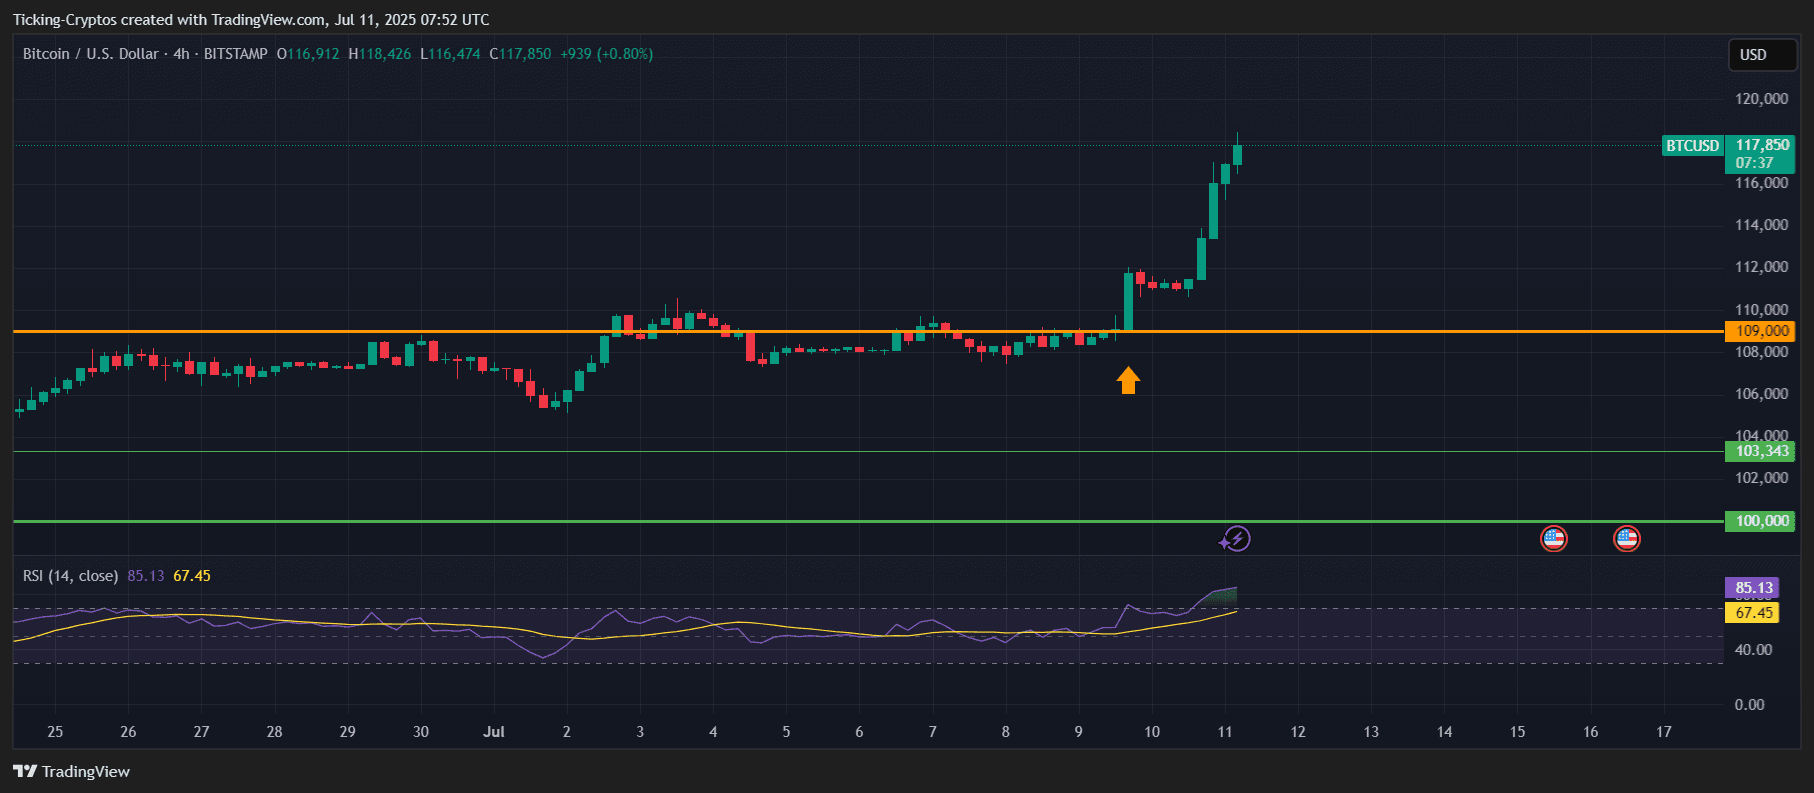
BTC/USD 4-hours chart –TradingView
Bitcoin: The Calm Before the Storm? For weeks, Bitcoin’s price danced a maddeningly tightrope between $105,000 and $110,000, leaving bulls and bears equally bewildered. But beneath the surface, a silent revolution was underway. Forget the stagnant price charts – whales were loading up. A tidal wave of institutional money is crashing into Bitcoin. On-chain whispers and bold public declarations paint a clear picture: hedge fund behemoths, publicly traded giants, and even nation-state funds are amassing Bitcoin at an alarming rate, all seeking refuge from a world teetering on the edge of economic chaos. Is this the fuse that finally ignites Bitcoin’s next explosive rally?
This surge in institutional demand finally tipped the balance, fueling the explosive breakout we’re seeing now.
BTC Chart Analysis: Momentum Has Taken Over
From a technical standpoint, the 4-hour BTC/USD chart paints a textbook breakout scenario:
Breakout Level: $109,000For two weeks, Bitcoin butted heads with an orange wall of resistance. Then, something shifted. A cluster of bullish candles huddled near the line, gathering strength like runners at the starting block (marked by the yellow arrow). Finally, the dam broke, and Bitcoin vaulted skyward, leaving the orange line behind as its newly forged launchpad.
Volume Surge & Bullish Candles$109K – Yesterday’s resistance, today’s launchpad. Once bulls conquered this key level, the market levitated. Forget cautious climbs; we’re talking skyscraper elevators. These aren’t just green candles; they’re redwood forests, erupting with relentless upward momentum. The absence of significant pullbacks? That’s not retail frenzy; that’s institutional titans planting their flag. This isn’t just bullish; it’s conviction painted in pure price action.
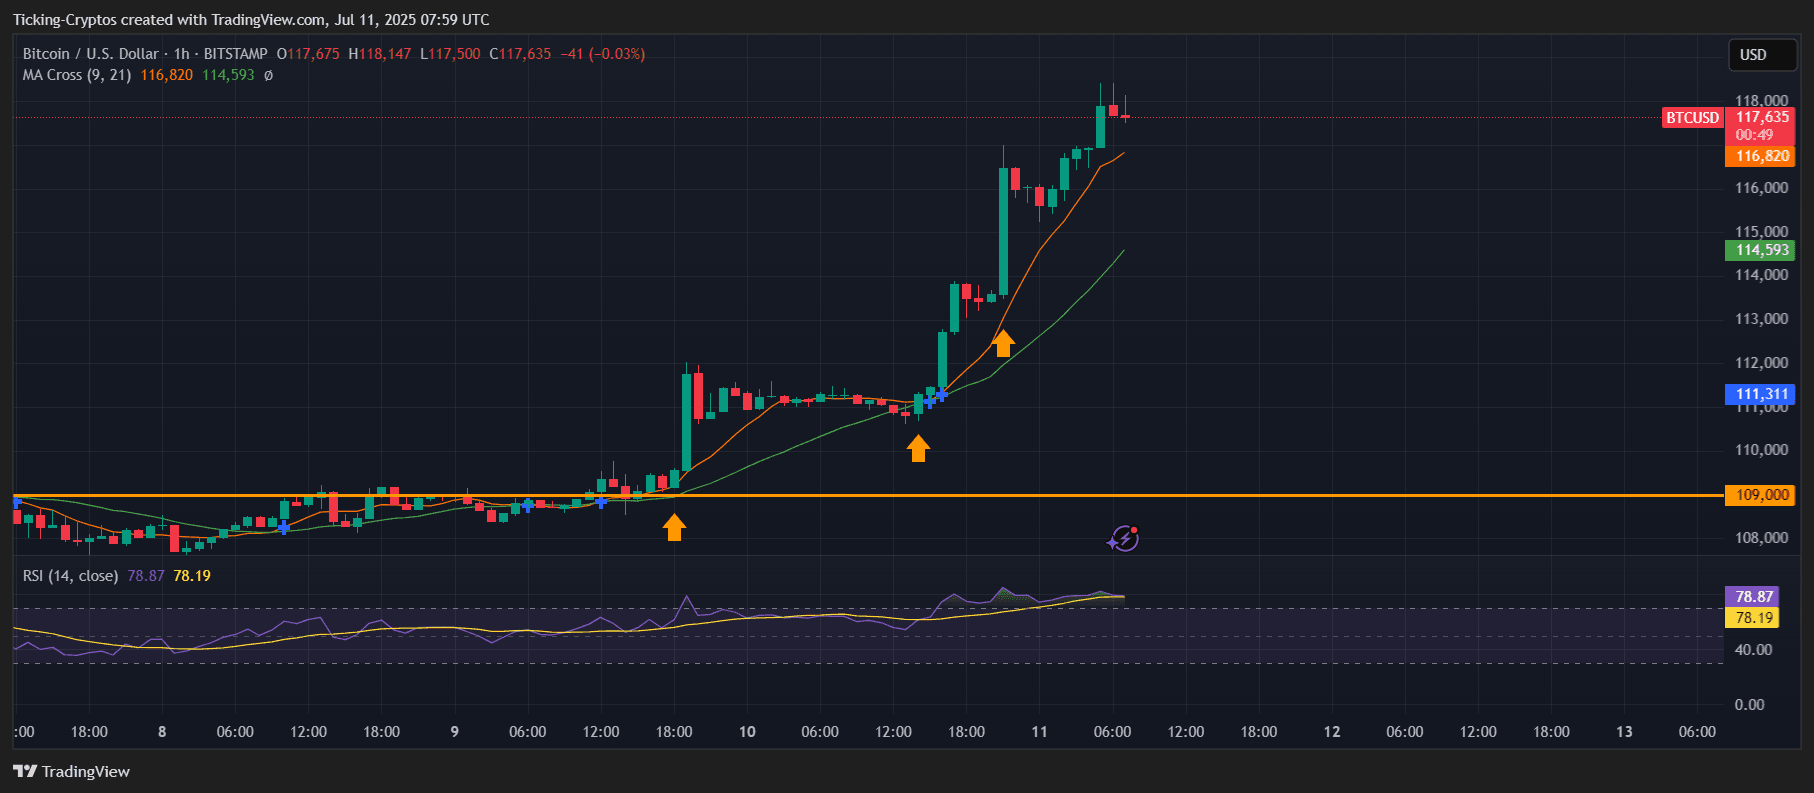
BTC/USD 2-hours chart –TradingView
Overbought RSI: 85.13The RSI is screaming “overbought,” clocking in above a scorching 85. Usually, this signals an impending dip. But hold on – this reading also screams raw, untamed bullish power. Until the RSI shows serious signs of cracking – minimal divergence, people! – this rocket ship is still fueled for liftoff.
Next Target ZonesBitcoin shatters records, blasting into uncharted territory! With the previous all-time high vanquished, the hunt for the next price peak is on. All eyes are now laser-focused on the $120,000 mark – a tantalizing blend of psychology and market mechanics. Will Bitcoin consolidate its gains? A brief dip back to the $109,000 breakout zone could be in the cards, but only if the bulls take a breather.
How to Buy Bitcoin Today – and Win a McLaren Experience
Is this the Bitcoin green light you’ve been waiting for? A potential breakout is flashing, and your entry point is now. Forget complex setups snagging $Bitcoin on OKX is ridiculously easy. Plus, they’re not just offering crypto; they’re handing out McLaren F1 swag and VIP experiences. Fast registration, secure trades, and a shot at the ultimate racing thrill. Ready to fuel your portfolio and your passion?
Thanks for reading BREAKING: Bitcoin Hits New All-Time High above $118K Heres What Happened
 Ethereum (ETH) and XRP!")
