Related Articles

Fibonacci Retracement and Why It Matters
Imagine Leonardo Fibonacci, or the math whiz of the 13th century, coming to recognize certain secret code in nature-the Fibonacci sequence, which is not merely a numerical sequence but, rather, a secret code behind the curvature of seashells, the patterns within sunflowers, and, God knows, even stock market pulses.
Enter the Fibonacci retracement-the decoder ring for reading your market. By finding the distance between the stock’s highs and lows and using the Fibonacci ratios, one can find their support and resistance levels. These are the hidden zones that might just cause the markets to pause or bounce away, if not change the direction. Imagine predicting tide on the basis of an obscure rhythm of the moon.
Unlocking Bitcoin’s Secrets: Fibonacci’s Golden Touch
If you could plot Bitcoin’s wild ride and nail the exact point where it might reverse, you’d be doing wonders. That’s how the Fibonacci retracement acts-as the trader’s secret sauce. Swings high and low are joined together, and wonderful levels appear: 23.6%, 38.2%, 50%, 61.8%, and 78.6%. Potential resistance and support zones can be seen as: Will Bitcoin defy gravity, or will these Fibonacci levels act as a trampoline, launching it back in its original direction? Time will tell, but Fibonacci gives you a fighting chance to anticipate the next move.
Applying Fibonacci Retracement to Bitcoin Charts
The Secrets of Bitcoin Uncovered by Fibonacci: Just imagine a treasure map laid over your Bitcoin chart. To create this map, first identify a major high and low. Now stretch your Fibonacci ruler-from the crest to the trough (or trough-to-crest in a rising market). Lo and behold! Horizontal lines emerge, hinting at covert support and resistance. These lines are not just lines but are potential launch pads on which to land an entry or an escape route for exits. Are you ready to trade Bitcoin using the golden ratio by Fibonacci?
Imagine Bitcoin surging for $100,000 from $80,000, a breathtaking peak! Gravity takes hold. Some savvy traders now become more intense observers of the 61.8% Fibonacci retracement level, placing the battle around $87,640. Will Bitcoin bounce back from here, re-energizing a fresh run on the upside? A bounce would confirm the bullish story. However, this level does act as a cautionary sign into the downside if broken while opening the doors to a test of the 78.6% retracement or full reversal. The Fibonacci sequence sheds light on likely support and resistance levels.
The Golden Ratio: 61.8%
Imagine the market as a grand symphony, and the 61.8% Fibonacci retracement as its golden note. This is no common level; rather, it’s the golden ratio, which echoes through nature, permeates antique architecture, and even shapes the proportions of our bodies. So what is the significance of doing so in trading? Simply because when enough traders start believing in the mystique of this number, price starts dancing to its rhythm. It becomes a self-fulfilling prophecy, a whisper in battered ears which might just bring about reversals, rallies, and rule changes for the gamers. Are you listening?

Bitcoin’s price movement is quite rhythmical with Fibonacci levels. But the 61.8% retracement is not just any level on the chart; rather, it becomes a battlefield with traders all over the world focusing on it, thus becoming a self-fulfilling prophecy. And whenever it combines with, for example, a trendline or moving average, it forms a strong nexus, the confluence of signals yelling “opportunity”. At this point, the smart players jump into this zone, fortify their positions with stop-losses, and establish profit targets to turn what could have been chaotic into a very precise procedure.
Combining Fibonacci With Other Technical Indicators
Fibonacci pulls won’t ever be solo acts. And smart traders will conduct them with a symphony of indicators: volume spikes, telling candlestick formations, the RSI murmuring overbought/oversold conditions, and the MACD moving their averages. Bitcoin goes down to the golden 38.2% retracement level. There is a bullish engulfing candle, and the RSI is dipping into oversold territory. It’s beyond just a signal; it is a very strong buying indication.
Imagine a price chart where the ghost of Fibonacci whispers some secrets, and the golden 50% retracement, upon touching the sturdy 200-period moving average, cultivates a strong support. It is no mere coincidence; it is a melodious harmony of signals. The more singers join in to fortify this Fibonacci level, the louder the market would be shouting on its significance, while yet more traders gain courage to raise their odds in its favor.
Retracement vs. Reversal: Reading the Signals
Don’t get bamboozled by a swift dip! Is it a retracement, a brief pause in the main trend, or is it a skirt-the-line-of-reversal, pretty-much-course-correction? If you lose focus on this, you might be abandoning ship too early or jumping in right at the turn of the tide. It is therefore an important skill to master to sail the market with a pro.
Is this merely a flash or the beginning of something greater? Fibonacci levels provide the traders with a clue when Bitcoin retraces. This is similar to being stress-tested by the market: If after hitting the 38.2% or 50% retracement levels, the price bounces back on increased buying volume, that is a clear signal that the uptrend is alive and kicking. Yet, if these crucial levels do not hold and the momentum starts to fade away, there may be a faint voice from the market that the tide is now turning.
Fibonacci Extension: Projecting Future Moves
No retracements to worry about. Fibonacci extensions work behind the scenes to reveal price targets when markets are surging higher. Just like retracements, they use high and low pivots but with one difference: they projectbeyondthe original price swing. The way to interpret them is that they are crystal balls showing probable resistance or support levels as the trend moves unforgivingly forward.
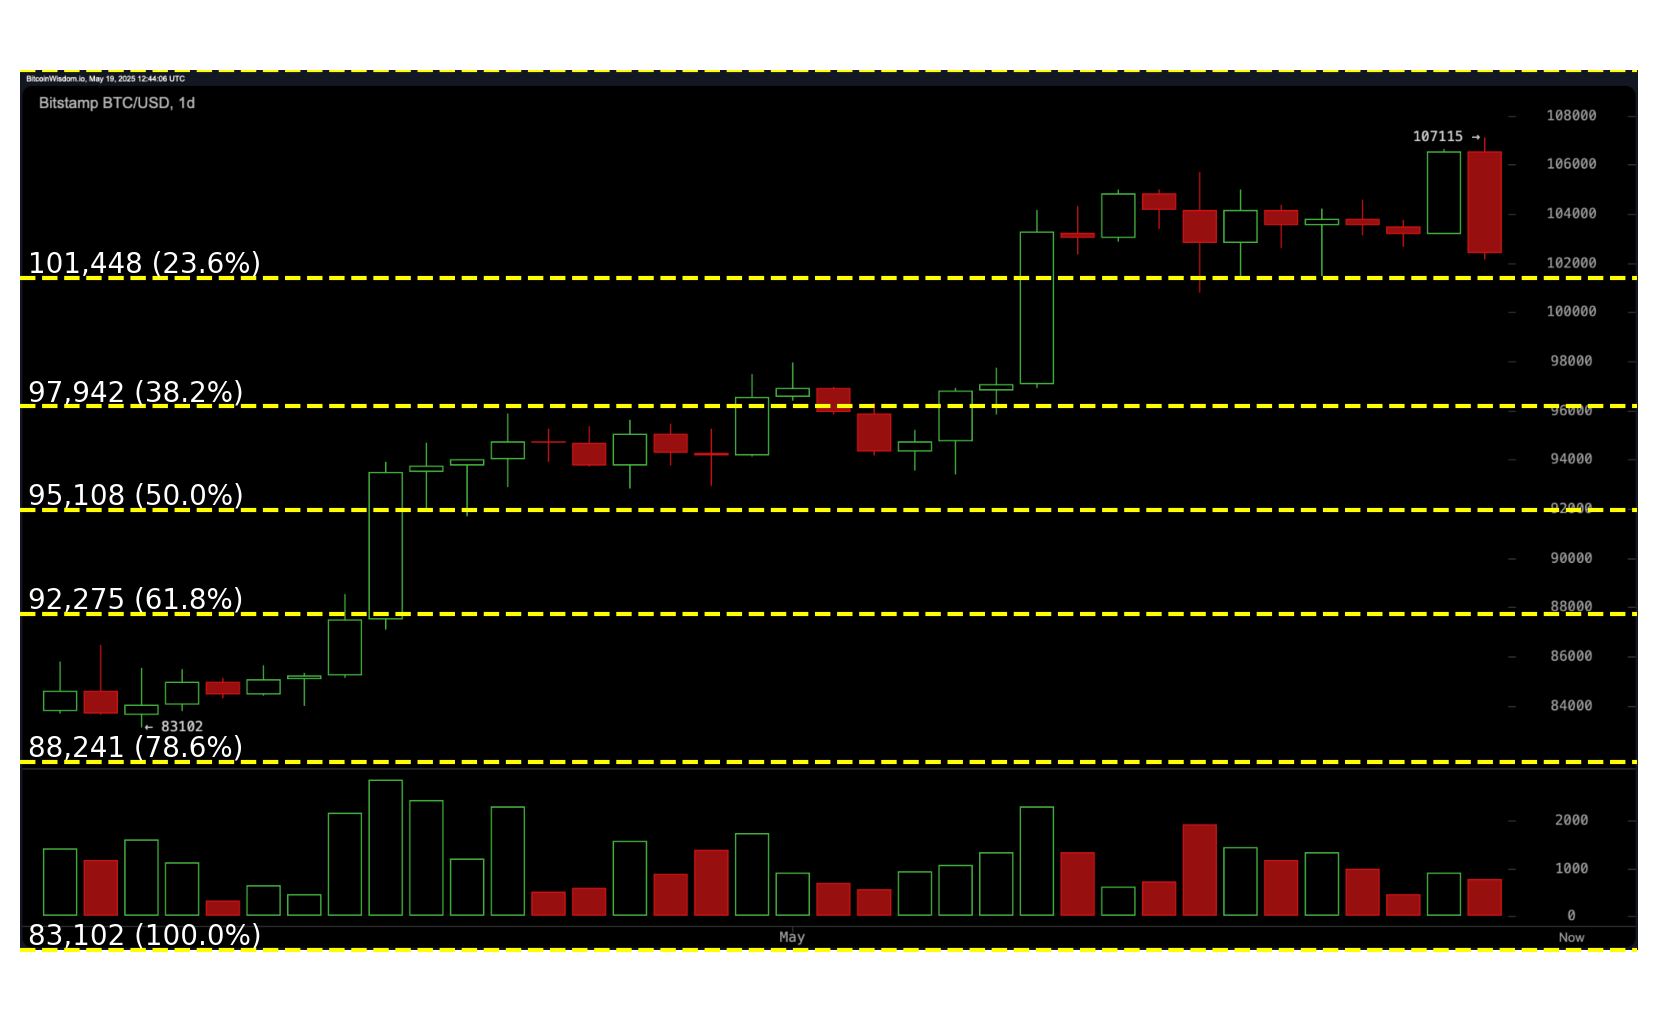
An overlay of Fibonacci Retracement on the BTC/USD daily chart on Monday, May 19, 2025.
Now, imagine Bitcoin rising above $90,000, touching $100,000, taking a breather around $95,000, and then starting energy once again to the upside. How thrilling! Fibonacci extensions act here as your crystal ball and may mark $106,180 as the next profit target. Use these projected levels to exit at higher prices, while the trend is moving: maximize your gains.
Limitations and Subjectivity
Fibonacci retracements: powerful but imperfect. The charms of their techniques were built on the ability to identify those really important swing highs and lows. Now, this is where the problem starts: charting is not an exact science. Where one considers a peak, another may see a plateau. Varying just a little on where to put those anchors can make the retracement levels quite different, so we must keep a careful and discerning eye.
The application of Fibonacci retracements is ideal with dominating trends. Otherwise, not in the sideways markets, that is. Imagine retracement levels as faint whispers in a loud room- they’re easily misheard. Savvy traders will wait for confirmations and will rely on other tools to drown out the noise before making their decisions.
Practical Use in Bitcoin’s Volatile Market
The cage that can contain Bitcoin requires a strategy. Forego the feeling the sway in prices demands exactness. Fibonacci retracements say that navigating crypto chaos is an art, an art to take profits and defend capital.
A well-charted trend is a glassy stream, while an unobserved one is an agitated river. A perfect alignment of the Fibonacci levels could serve to pacify the nature of an unobserved trend. In other words, the four-hour charts make for wonderful swing trading, while daily and weekly charts may be used to analyze bigger trends-Fibonacci giveth and Fibonacci taketh away. This is the one tool: with a myriad of unpredictable events, where fortunes change at the flip of a dime, one couldn’t live without it.
Mastering the Fibonacci Mindset
Fibonacci retracements: Not a crystal ball; rather, a compass. It charts likely areas of market attraction-psychological price points that might trigger the herd instinct. So, let go of fortune-telling, and welcome probabilities. Used correctly, Fibonacci retracements would allow a trader to stay away from emotional wagers and travel deliberately through the uncertainty of the markets.
Bitcoin, the roller coaster, drives you up the wall? Fibonacci retracements offer a mathematical oasis in the desert of a trader’s emotion. Though it might be called those for Bitcoin, traders worldwide teach-from-hand this relic-Fibonacci is forever in solving the ancient mysteries of markets all over.
Thanks for reading Fibonacci Retracement: A Trader’s Compass in the Bitcoin Market
 Ethereum (ETH) and XRP!")
