Key takeaways :
- In 2025, HBAR is expected to trade between $0.2629 and $0.2975, with an average trading price of $0.2723.
- In 2028, HBAR is predicted to trade at a maximum price of $0.9634, with an average price of $0.8191.
- By 2031, HBAR could trade between $2.48 and $2.84, with an average price of $2.56
Hedera Hashgraph (HBAR) emerged as a cryptocurrency to watch during the 2021 bull run, capturing the attention of traders and investors alike. But HBAR is more than just a beneficiary of a rising tide; the Hedera Hashgraph network itself shows signs of disrupting the blockchain landscape. What does the future hold for this intriguing digital asset?
HBAR’s price got you down? You’re not alone. Amidst this crypto winter, HBAR’s shown surprising resilience. Are the charts hinting at a thaw? Positive indicators and growing buzz suggest a possible breakout. Could we be gearing up for a run, maybe even a nostalgic revisit to its peak? Keep watching.
Overview
| Cryptocurrency | Hedera Hashgraph |
| Ticker | HBAR |
| Current Price | $0.2391 |
| Market Cap | $10.13B |
| Trading Volume (24Hr) | $432.15M |
| Circulating Supply | 50 Billion HBAR |
| All-time High | $0.5701 on Sep 16, 2021 |
| All-time Low | $0.01001 on Jan 03, 2020 |
| 24-hour High | $0.2413 |
| 24-hour Low | $0.2262 |
HBAR price prediction: Technical analysis
| Metric | Value |
| Volatility | 7.55% |
| 50-day SMA | $ 0.200503 |
| 200-day SMA | $ 0.150378 |
| Sentiment | Bullish |
| Fear & Greed Index | 53 (Neutral) |
| Green Days | 17/30 (40%) |
Hedera Hashgraph (HBAR) price analysis
- HBAR is showing early signs of recovery from its recent decline but remains below key resistance levels
- The daily chart suggests possible consolidation between 22 and 26 cents unless strong buying pressure returns
- Short-term momentum indicators are turning slightly bullish but lack confirmation from volume or strength metrics
HBAR price analysis 1-day chart
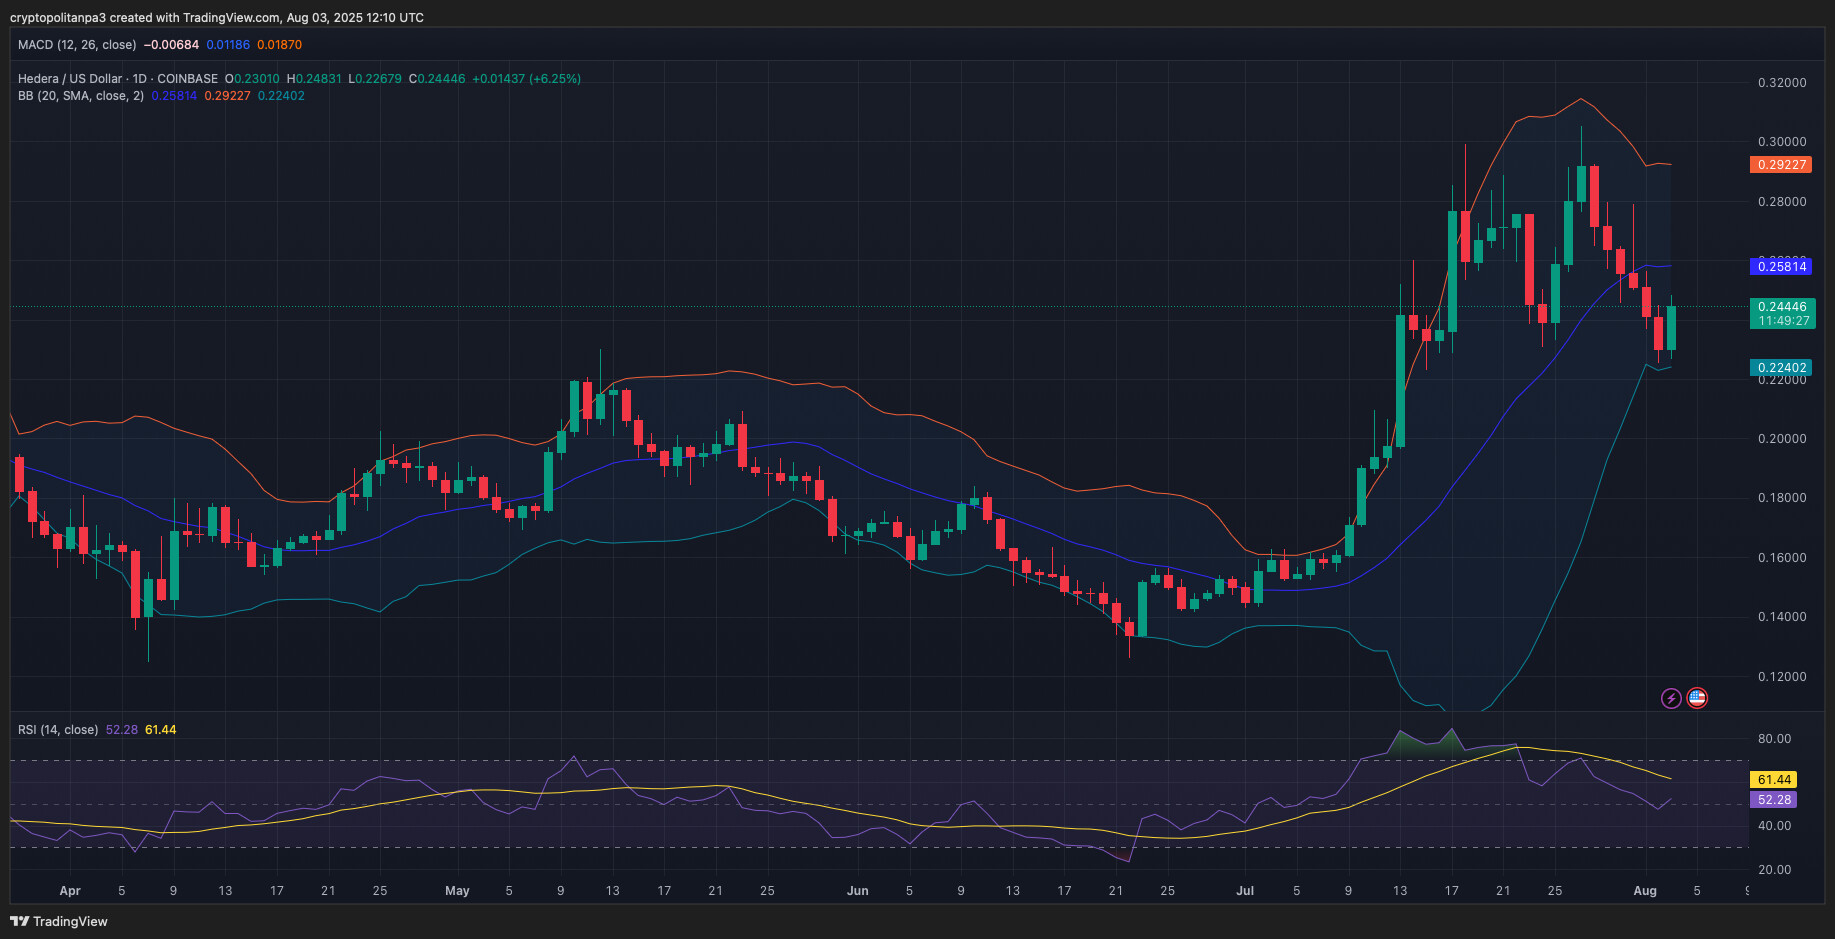
HBARUSD chart by TradingView
Hedera (HBAR) is flexing some serious muscle on the 1-day chart, staging a bullish comeback after bouncing off the $0.24 mark. But hold up, HBAR’s heading for a showdown with the upper Bollinger Band at $0.31 – could this be the resistance boss level?
The RSI’s flashing “overbought” at 72.99, whispering that the rally might be running out of gas. The MACD is still green, fueling the bullish narrative, but the histogram’s shrinking, hinting that buyers might be hitting the brakes.
Here’s the deal: If HBAR smashes through $0.31 with enough oomph (read: volume), we could see a run at previous peaks. But if the resistance holds, brace for a potential retreat back to $0.27 or even a dip down to the mid-band safety net around $0.24. Keep your eyes peeled!
HBAR/USD 4-hour price chart
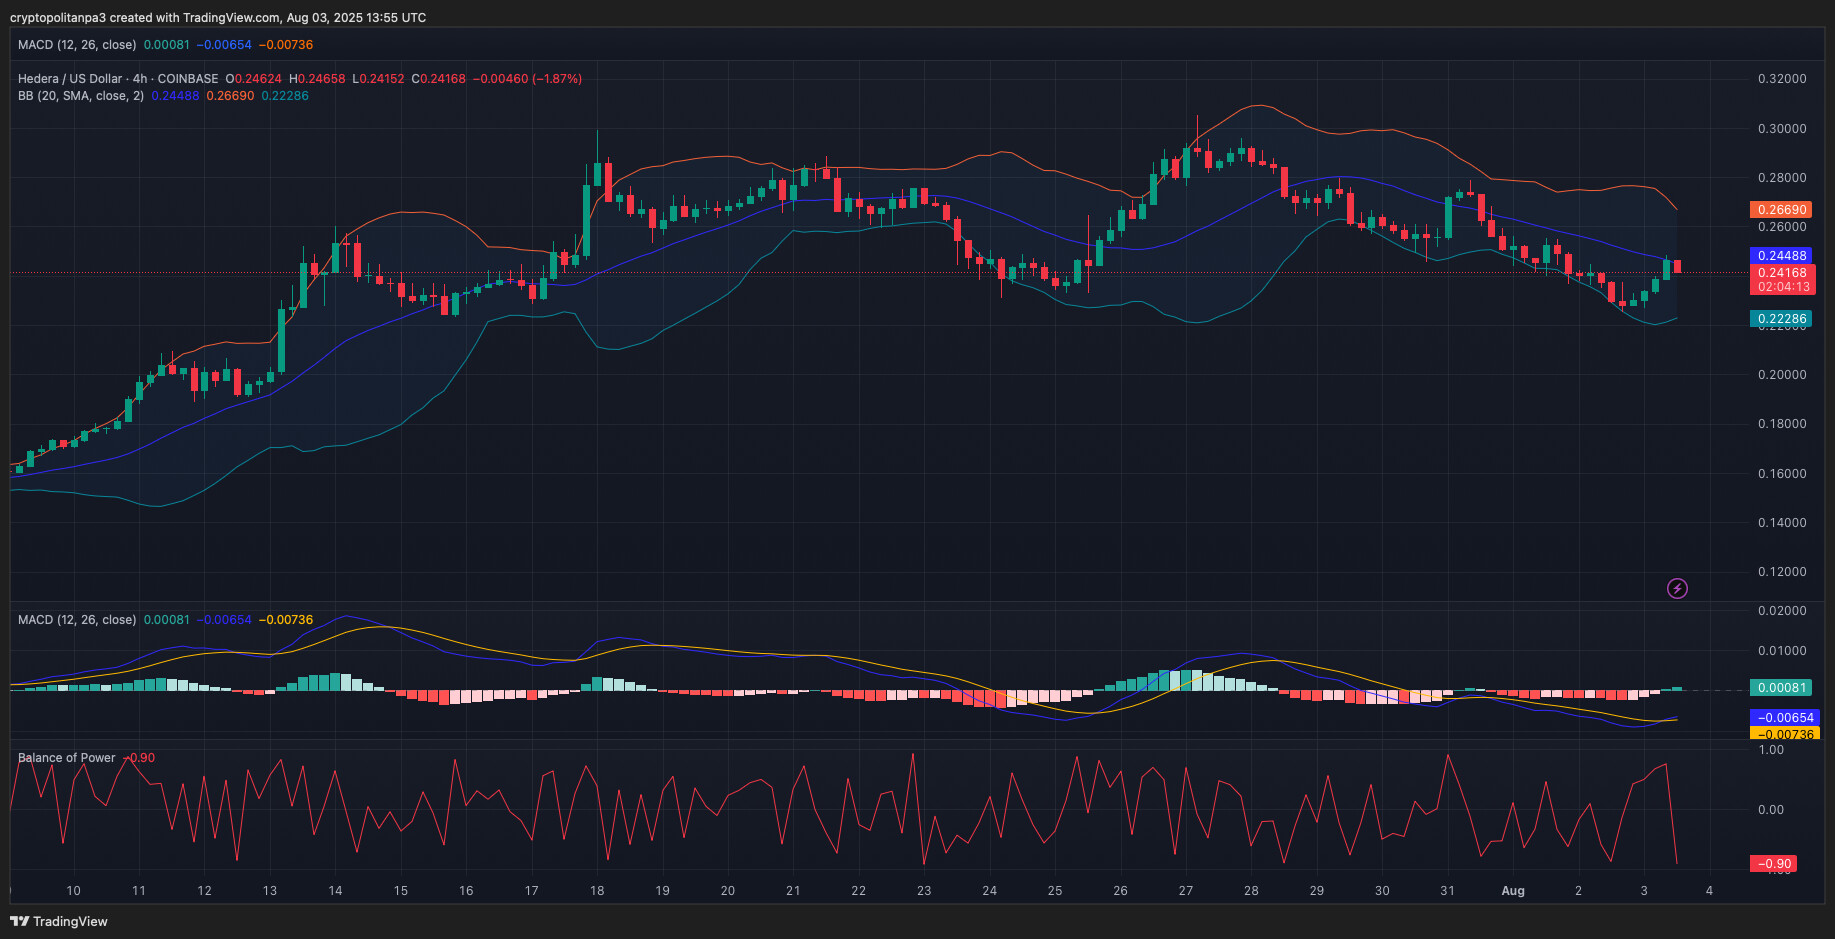
HBARUSD chart by TradingView
Hedera (HBAR) is staging a comeback on the 4-hour chart after brushing against the lower Bollinger Band. Currently wrestling with the middle band resistance at $0.244, HBAR’s fate hangs in the balance. The MACD is whispering bullish promises with a tentative crossover, hinting at an upward surge if the bulls bring the firepower. But beware, the Balance of Power still languishes at -0.90, a sign that buyers are struggling to seize the reins.
The magic numbers? Hold above $0.241, conquer $0.245, and $0.26 becomes the next battleground. Failure to breach this resistance could trap HBAR in a sideways dance or send it spiraling back to $0.224 support. The coming hours will reveal if HBAR can break free or be pulled back into the depths.
HBAR technical indicators: Levels and action
Simple moving average (SMA)
| Period | Value ($) | Action |
| SMA 3 | $ 0.207857 | BUY |
| SMA 5 | $ 0.235474 | BUY |
| SMA 10 | $ 0.254151 | SELL |
| SMA 21 | $ 0.257686 | SELL |
| SMA 50 | $ 0.200503 | BUY |
| SMA 100 | $ 0.194099 | BUY |
| SMA 200 | $ 0.150378 | BUY |
Daily exponential moving average (EMA)
| Period | Value ($) | Action |
| EMA 3 | $ 0.235512 | BUY |
| EMA 5 | $ 0.218193 | BUY |
| EMA 10 | $ 0.198731 | BUY |
| EMA 21 | $ 0.187619 | BUY |
| EMA 50 | $ 0.194368 | BUY |
| EMA 100 | $ 0.20522 | BUY |
| EMA 200 | $ 0.191244 | BUY |
What can you expect from the HBAR price analysis next?
Hedera (HBAR) is staging a comeback, clawing its way back from a sharp fall from July’s peak near $0.31. Technical charts paint a cautiously optimistic picture. The daily chart reveals a bounce from oversold territory (think coiled spring), but the 20-day SMA around $0.258 is looming as a potential ceiling. The RSI suggests renewed vigor, but momentum needs fuel. Zooming into the 4-hour view, a faint MACD crossover hints at building bullish pressure, though buying strength, per the Balance of Power indicator, is still soft. Expect HBAR to trade within a tight range of $0.22 to $0.26 unless a surge of volume ignites a breakout. Is this a true reversal, or just a bear market bounce? The volume holds the key.
Is HBAR a good investment?
Forget slow and clunky blockchains. Hedera Hashgraph bursts onto the scene with its revolutionary Hashgraph consensus, promising lightning-fast speeds, impenetrable security, and boundless scalability. Imagine a future where HBAR fuels a new era of distributed ledgers, powering everything from blazing-fast smart contracts to groundbreaking decentralized applications. Is HBAR poised to redefine the digital landscape and skyrocket to unprecedented heights? Savvy investors are betting on it.
Will HBAR reach $1?
Can Hedera Hashgraph (HBAR) break the $1 barrier? The answer dances on the edge of possibility. HBAR boasts blazing-fast, dirt-cheap transactions and enjoys heavyweight enterprise support, but its journey to a dollar hinges on a perfect storm: thriving market conditions, explosive adoption by users and businesses, and a groundswell of positive crypto vibes. Keep your eyes peeled – the HBAR story is far from written.
HBAR’s ascent hinges on widespread adoption across DeFi, NFTs, and enterprise solutions, potentially igniting a price surge. Yet, fierce competition from rival blockchains and evolving regulations could impede its trajectory. To conquer the $1 mark, HBAR requires a powerful bullish crypto wave and substantial institutional backing. While within reach, achieving enduring value and unwavering investor trust is paramount for long-term price appreciation.
What will HBAR be worth in 2025?
By 2025, HBAR is expected to be worth $0.2975.
How much will HBAR cost in 2030?
By 2030, HBAR is expected to be worth $1.98.
Can HBAR reach $20?
Can HBAR defy gravity and soar to $20? Let’s be realistic. That price target isn’t just ambitious; it’s a moonshot requiring a market miracle. Imagine HBAR at $20 – a colossal $660 billion market cap! We’re talking Bitcoin and Ethereum territory. With 33 billion HBAR already circulating, that kind of valuation isn’t just unlikely; it’s a complete reimagining of the crypto landscape.
Where to buy HBAR?
Traders and investors can buy Hederah Hashgraph (HBAR) on these CEXs: Binance, KuCoin, HTX, Bybit, Bitget, and others.
Will HBAR reach $10?
$10 HBAR by 2030? Don’t bet on it. Reaching that sky-high price tag would demand a market cap of epic proportions, a feat bordering on the impossible. While some optimists dream of double-digit HBAR, current projections paint a more grounded picture: think somewhere between $1.60 and $1.66 by the decade’s end. So, unless a black swan event catapults HBAR into the stratosphere, $10 remains a moonshot at best.
Will HBAR reach $100?
Hederah Hashgraph (HBAR) reaching $100 is highly ambitious and would require exceptional growth, widespread adoption, and wild market speculation.
Does HBAR have a good long-term future?
HBAR: Tomorrow’s Crypto Titan or Fleeting Trend?
Hedera Hashgraph (HBAR) isn’t just another coin; it’s a contender. Should it maintain its current trajectory of growing popularity and real-world applications, analysts foresee a climb to $0.2055 by 2025 and a potentially lucrative $1.30 by 2030. But hold on – the crypto world is a wild ride. Like any altcoin, HBAR’s fate hinges on the unpredictable dance of market sentiment and the unwavering belief of its community. Will it become a cornerstone of the decentralized web, or fade into the digital ether? Only time will tell.
Recent news/opinion on HBAR
Hedera’s core developer hive is buzzing! With 126 active contributors, the network boasts the second-highest activity, signaling a vibrant community fueling innovation. This developer power surge paves the way for groundbreaking tools like CLI and AI Studio, promising an expanding ecosystem. However, the ultimate test lies in the hands of the users. To truly flourish, Hedera needs to drive significant transaction volume and tackle critical questions surrounding centralization and overall ecosystem robustness. The code is strong, but the community must follow for Hedera to truly conquer.
Last week, @Hedera had the second largest core developer base as per @tokenterminal 🛠️ pic.twitter.com/KpojRtko8Y
Hedera Foundation (@HederaFndn) July 2, 2025
Hedera Hashgraph price prediction August 2025
Hedera’s HBAR: Poised for a Potential Surge to $0.25 by August 2025?
Analysts predict Hedera Hashgraph could see a minimum price of $0.2232 by August 2025. Optimistic forecasts suggest a climb to $0.2538, with an average trading value settling around $0.2467. Will HBAR defy expectations or align with projected growth?
| Hedera price prediction | Potential Low ($) | Average Price ($) | Potential High ($) |
| Hedera price prediction Aug 2025 | $ 0.2232 | $ 0.2467 | $ 0.2538 |
HBAR crypto price prediction 2025
HBAR in 2025: Buckle up! Experts predict an average price of $0.27, but fortunes could favor the bold, potentially soaring to nearly $0.30. Even in a dip, HBAR’s floor seems solid at around $0.26. Think measured optimism with a shot of moonshot potential.
| Year | Potential Low ($) | Average Price ($) | Potential High ($) |
| 2025 | $0.2629 | $0.2723 | $0.2975 |
Hedera Hashgraph forecast 2026-2031
| Year | Potential Low ($) | Average Price ($) | Potential High ($) |
| 2026 | $0.3898 | $0.4034 | $0.4660 |
| 2027 | $0.5532 | $0.5693 | $0.6719 |
| 2028 | $0.7963 | $0.8191 | $0.9634 |
| 2029 | $1.14 | $1.18 | $1.36 |
| 2030 | $1.60 | $1.66 | $1.98 |
| 2031 | $2.48 | $2.56 | $2.84 |
HBAR price prediction 2026
Forget rocket science, let’s talk crypto fortune-telling! Crystal ball gazing for Hedera Hashgraph (HBAR) in 2026? Experts whisper of prices dancing between $0.39 and $0.47, landing around $0.40 on average. Is this the future of your portfolio?
HBAR price prediction 2027
The 2027 forecast predicts HBAR will trade between $0.5532 and $0.6719, with an average price of $0.5693.
HBAR price prediction 2028
Imagine HBAR in 2028: soaring to a potential high of $0.96, averaging around $0.82, and establishing a solid floor near $0.80. Buckle up, because these numbers suggest a thrilling ride of market expansion is on the horizon.
HBAR price prediction 2029
By 2029, HBAR isn’t aiming for the moon; it’s planting roots. Expect a period of stability, with prices hovering between $1.14 and $1.36, averaging around $1.18. Think of it as HBAR hitting its stride – a mature network solidifying its position in the digital landscape. This isn’t about explosive growth; it’s about lasting power.
HBAR price prediction 2030
Hedera’s poised for a 2030 surge! Buckle up, because projections show this crypto contender potentially hitting a high of $1.98, with a solid average of $1.66. That’s not just growth; it’s a market buzz hinting at Hedera’s bright future.
HBAR price prediction 2031
Imagine HBAR in 2031: not a distant dream, but a tangible reality. Experts whisper of a potential peak at $2.84, a summit fueled by groundbreaking adoption and real-world utility. But the real story lies in the steady climb, a solid average of $2.56, with a floor no lower than $2.48. This isn’t just speculation; it’s a glimpse into a future where HBAR is a cornerstone of the decentralized world.
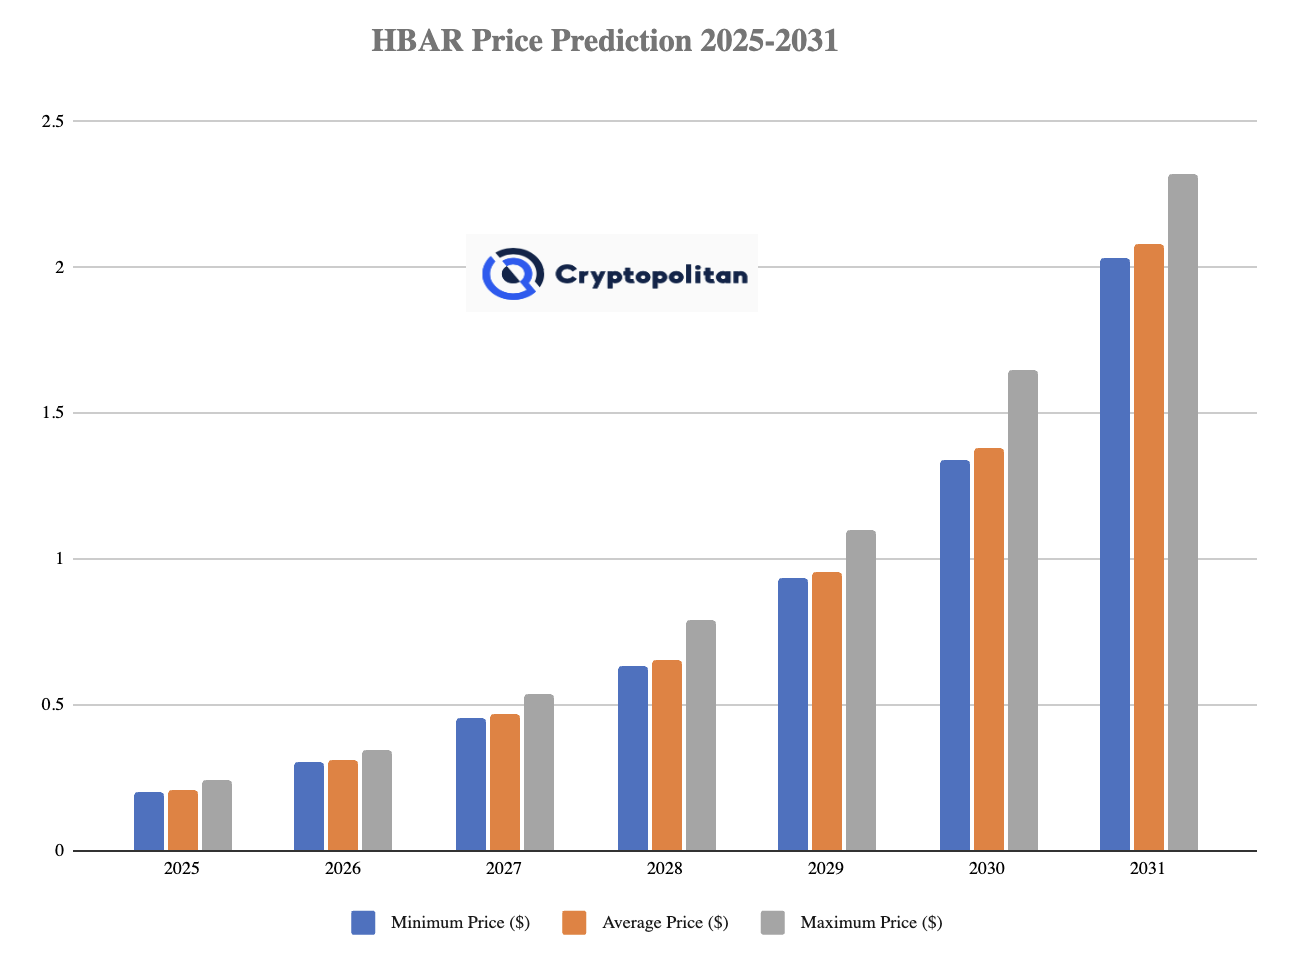
Hedera HBAR price prediction 2025-2031
Hedera market price prediction: Analysts’ HBAR price forecast
| Firm | 2025 | 2026 |
| Coincodex | $ 0.44889 | $ 0.390902 |
| DigitalCoinPrice | $0.52 | $0.61 |
Cryptopolitan’s Hedera Hashgraph price forecast
Cryptopolitan projects a potentially bullish outlook for HBAR, forecasting a peak of $0.1644 by late 2025, followed by a surge to $0.312 in 2026. However, remember to do your own research, as these predictions are purely speculative, not financial gospel.
Hederah Hashgraph’s historic price sentiment
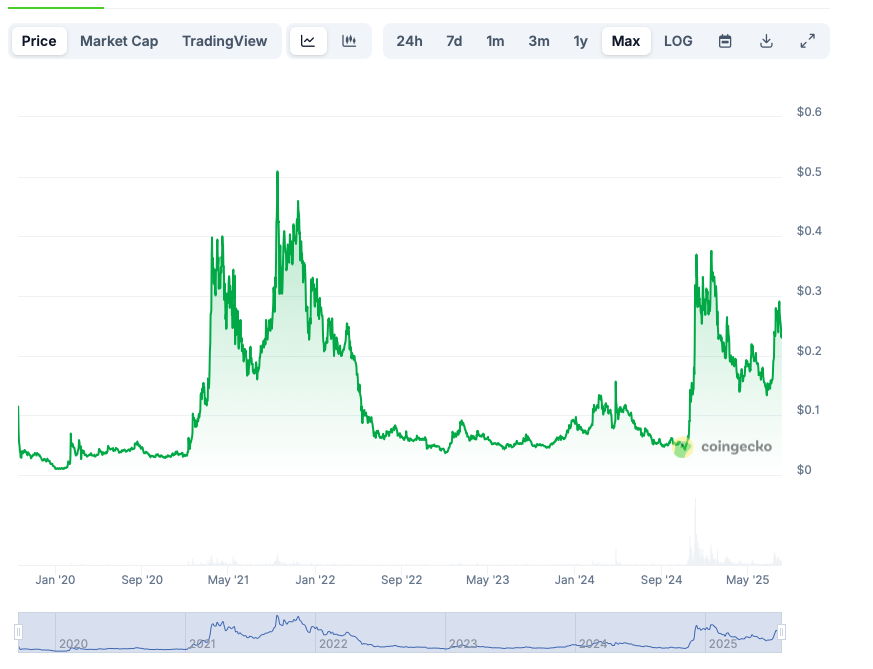
HBAR price history; Source: Coingecko
- In 2019, HBAR started with a negligible value, fluctuating before ending the year near $0.01.
-
HBAR opened 2021 at $0.03, rising to $0.10 by early February due to active network developments. HBAR’s 2024 was a rollercoaster. It soared to nearly $0.18 in April, only to plummet to a devastating $0.05 by September. But then, a phoenix-like rise – a surge to $0.30 in December before settling around $0.29 to close out the year.
-
January 2025 saw stable trading between $0.30 and $0.31, ending at $0.30.
- In February, HBAR dipped to the $0.25–$0.26 range, then declined further in March to around $0.20.
- As of June, HBAR trades between $0.17 and $0.18 after closing May at $0.1874.
- HBAR ended June at $0.147. At the start of July, HBAR has increased, and it currently trades at $0.16
- HBAR declined from approximately $0.25 on July 31 to about $0.23on August 2, 2025.
- The price rebounded slightly to around $0.24 by August 3, 2025.
Thanks for reading HBAR price prediction 2025-2031: Hedera Hashgraph soon to retest its ATH?
