Related Articles

Pi Network’s price is stuck in a rut, constantly rebuffed by a stubborn downward trendline. Currently circling $0.459, the price action has drifted into a critical demand zone, a potential battleground for buyers. But the bears still hold sway. Despite flirting with this key level, bullish momentum remains elusive; no clear sign of a trend reversal is on the horizon. Will the bulls finally muster the strength to break free, or will the descent continue?
What’s Happening With Pi’s Price?
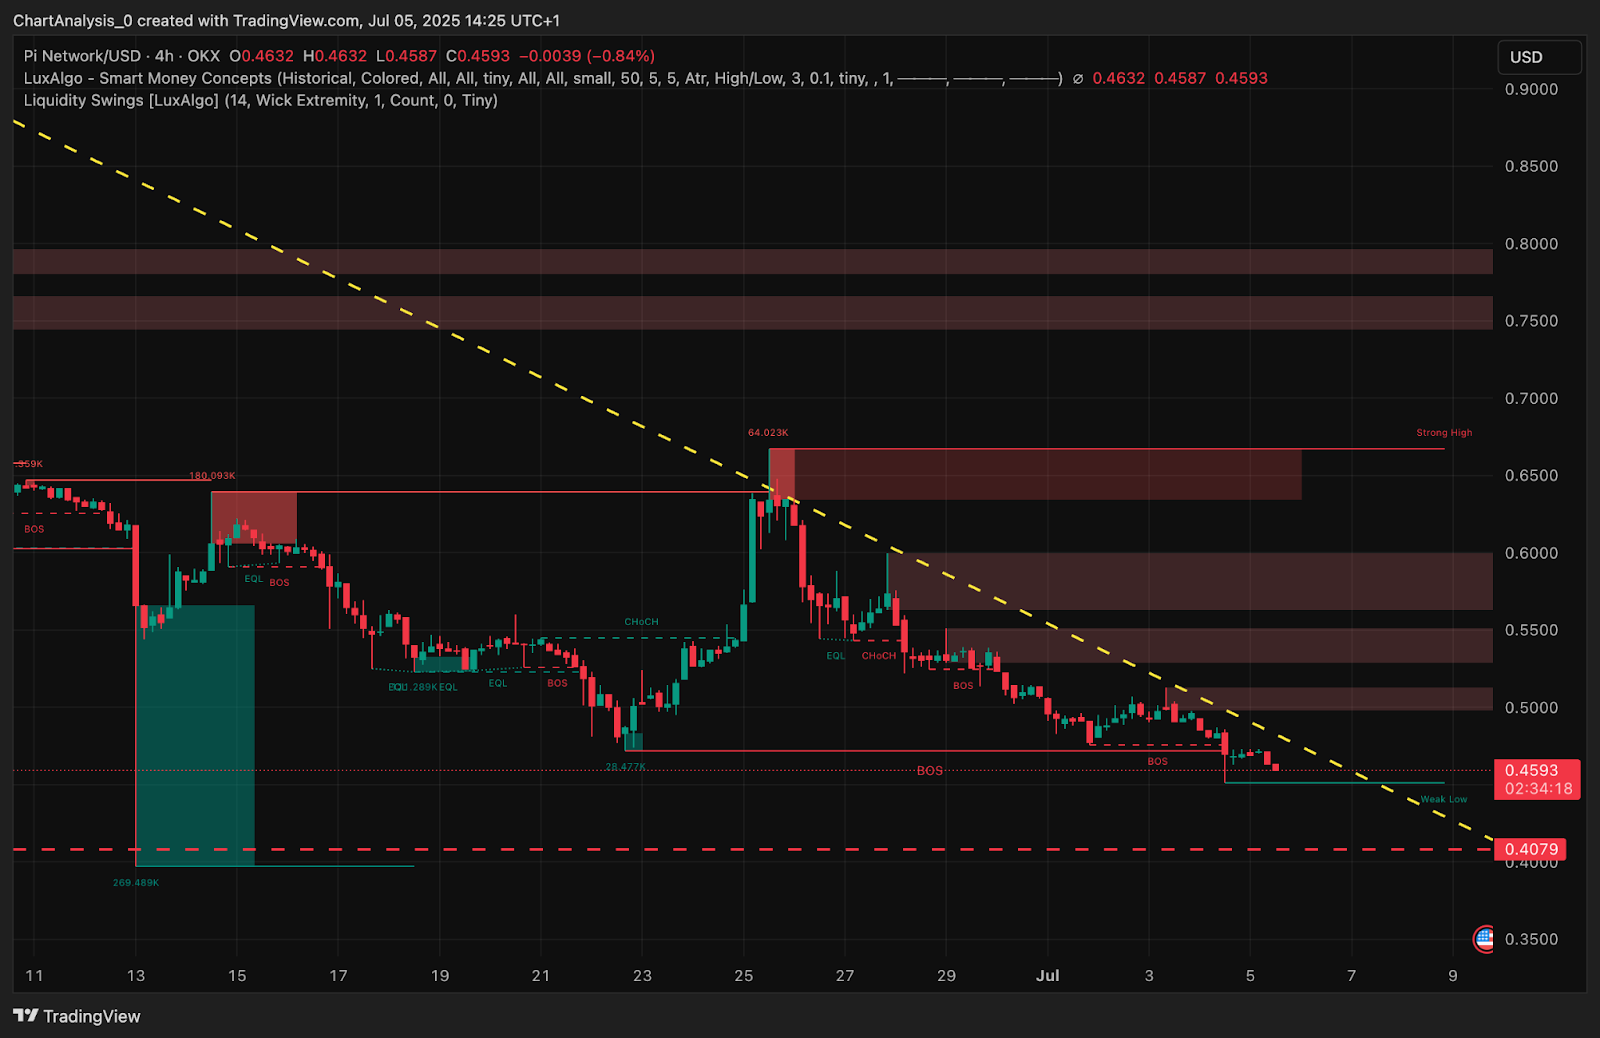
Pi Network price dynamics (Source: TradingView)
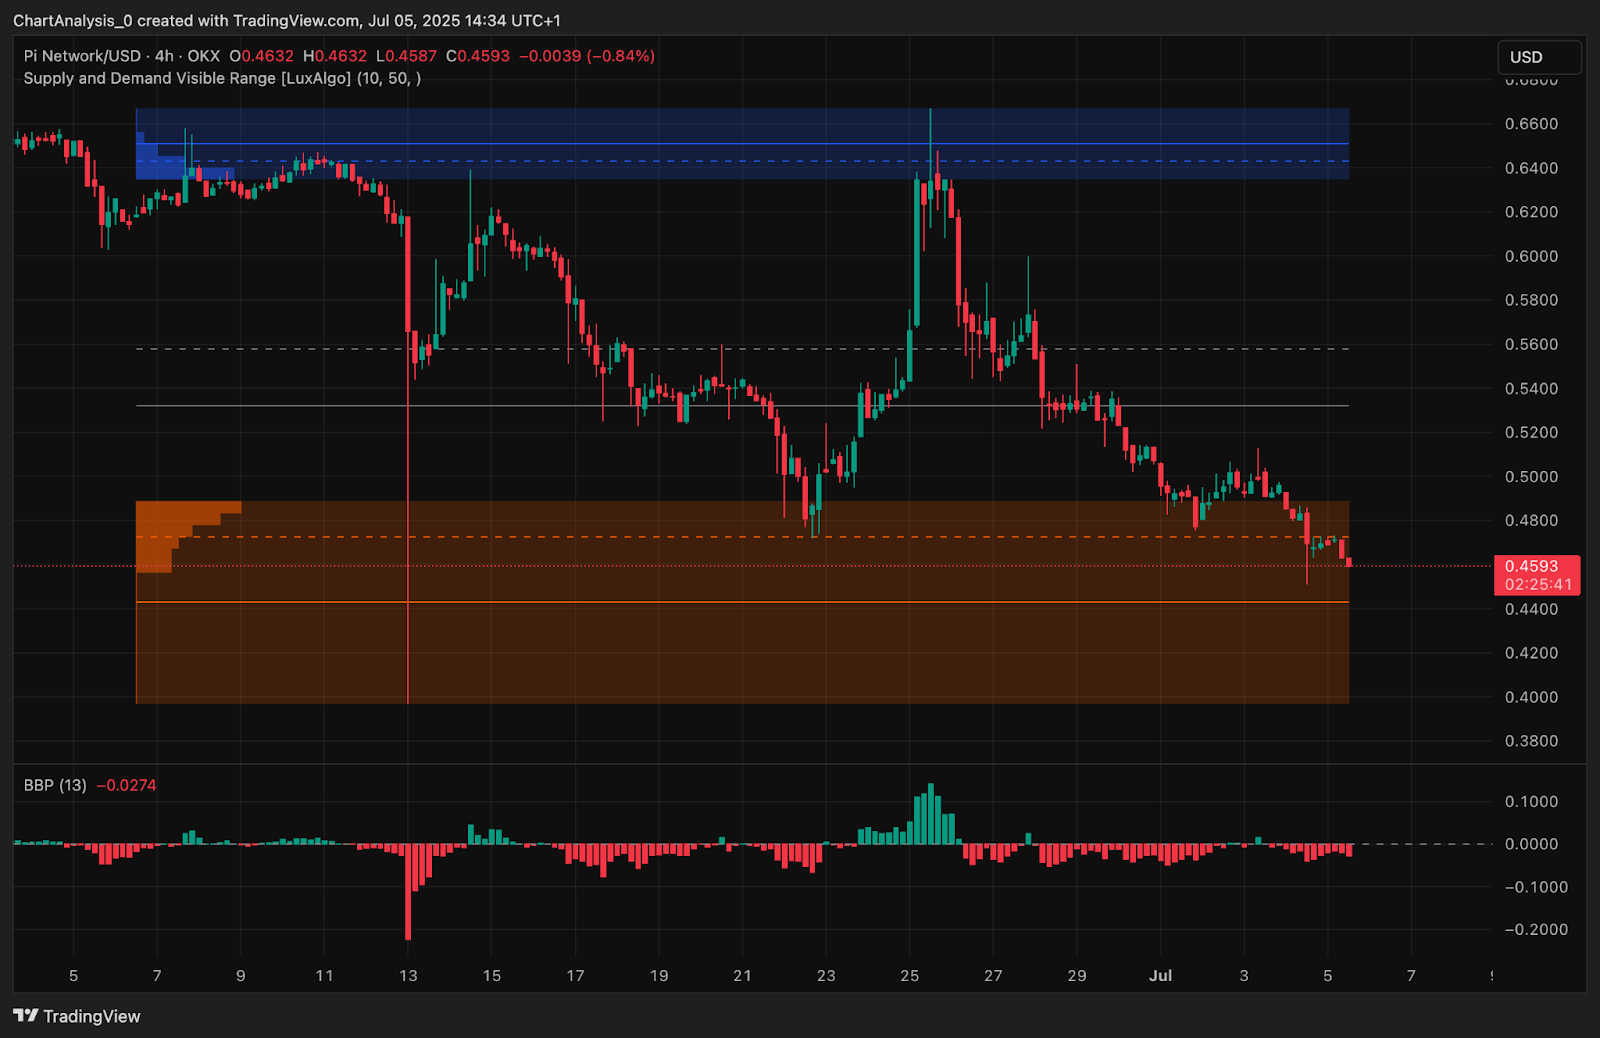
The Pi Network price chart is telling a story of thwarted ambition. Trapped in a relentless downward spiral since its $0.64 peak, the price bounces listlessly within a defined falling channel. Each hopeful surge against the current quickly fizzles, slamming against the channel’s upper trendline like a moth to a flame. These failed breakouts aren’t just setbacks; they’re clear signals. Each failure carves a new lower high, a fresh “Break of Structure,” and a chilling “Change of Character,” all whispering the same thing: sellers remain firmly in control.
$0.459 marked a feeble bottom recently, punctuated by yet another break of structure just beneath it. Eyes now lock onto the juicy liquidity pool lurking under $0.44 – a siren song for short-term traders. Bears are fiercely guarding the $0.50–$0.55 imbalance zone, repelling all bullish advances. Meanwhile, upward momentum has crashed against a wall of supply residing between $0.64 and $0.66, leaving bulls battered and bruised.
Why Is the Pi Network Price Going Down Today?
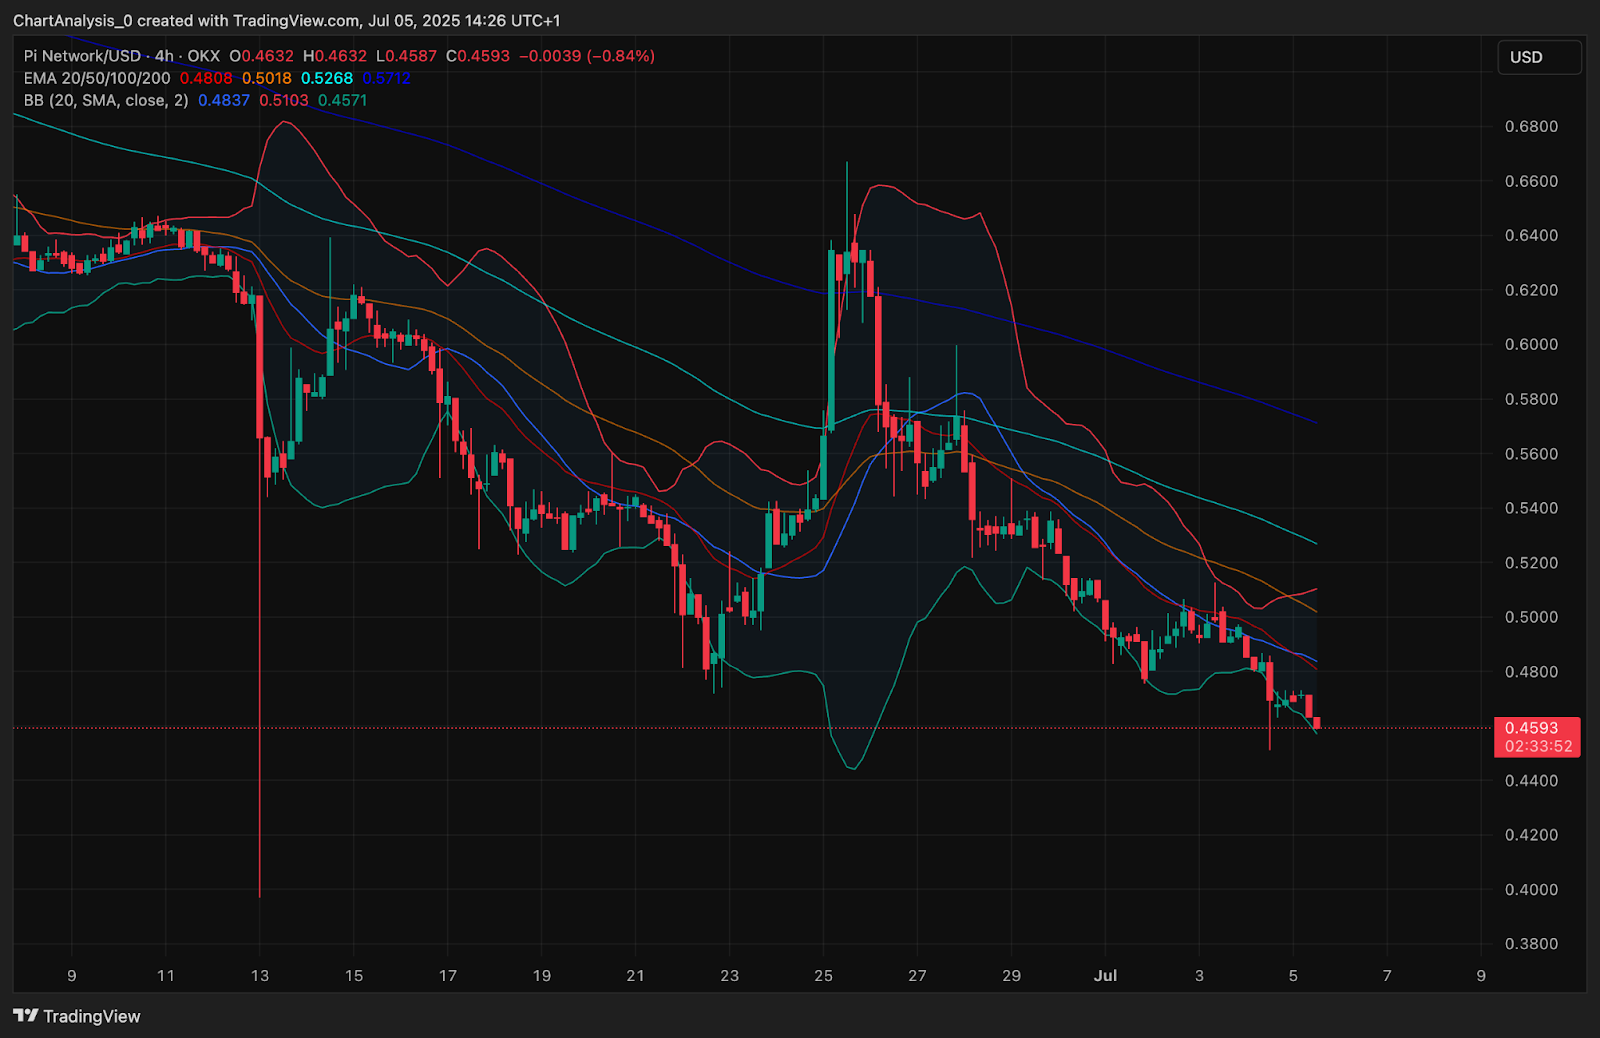
Pi Network price dynamics (Source: TradingView)
Pi Network’s price is caught in a perfect storm of bearish signals today. A glance at the 4-hour chart reveals a troubling picture: a death cross of EMAs. The 20, 50, 100, and 200 EMAs are aligned in a bearish formation, suffocating any upward momentum. Currently pinned below all major moving averages, Pi’s price faces an uphill battle. The 20 EMA, hovering around $0.488, is proving to be an impenetrable ceiling, relentlessly rejecting bullish advances.
Bollinger Bands are coiling tighter than a viper ready to strike, price pinned against the $0.457 lower band. This pressure cooker setup often precedes explosive volatility. Short, indecisive candles keep shying away from the midline, screaming “bulls are MIA.” Get ready; something’s about to give.

Pi Network price dynamics (Source: TradingView)
The 30-minute chart whispers a tale of dwindling strength. RSI, clinging to 39.9, suggests the bears are gaining ground, though the market hasn’t fully surrendered. Look closer: the MACD histogram paints a picture of fading energy, its lines flirting with a potentially ominous bearish kiss.
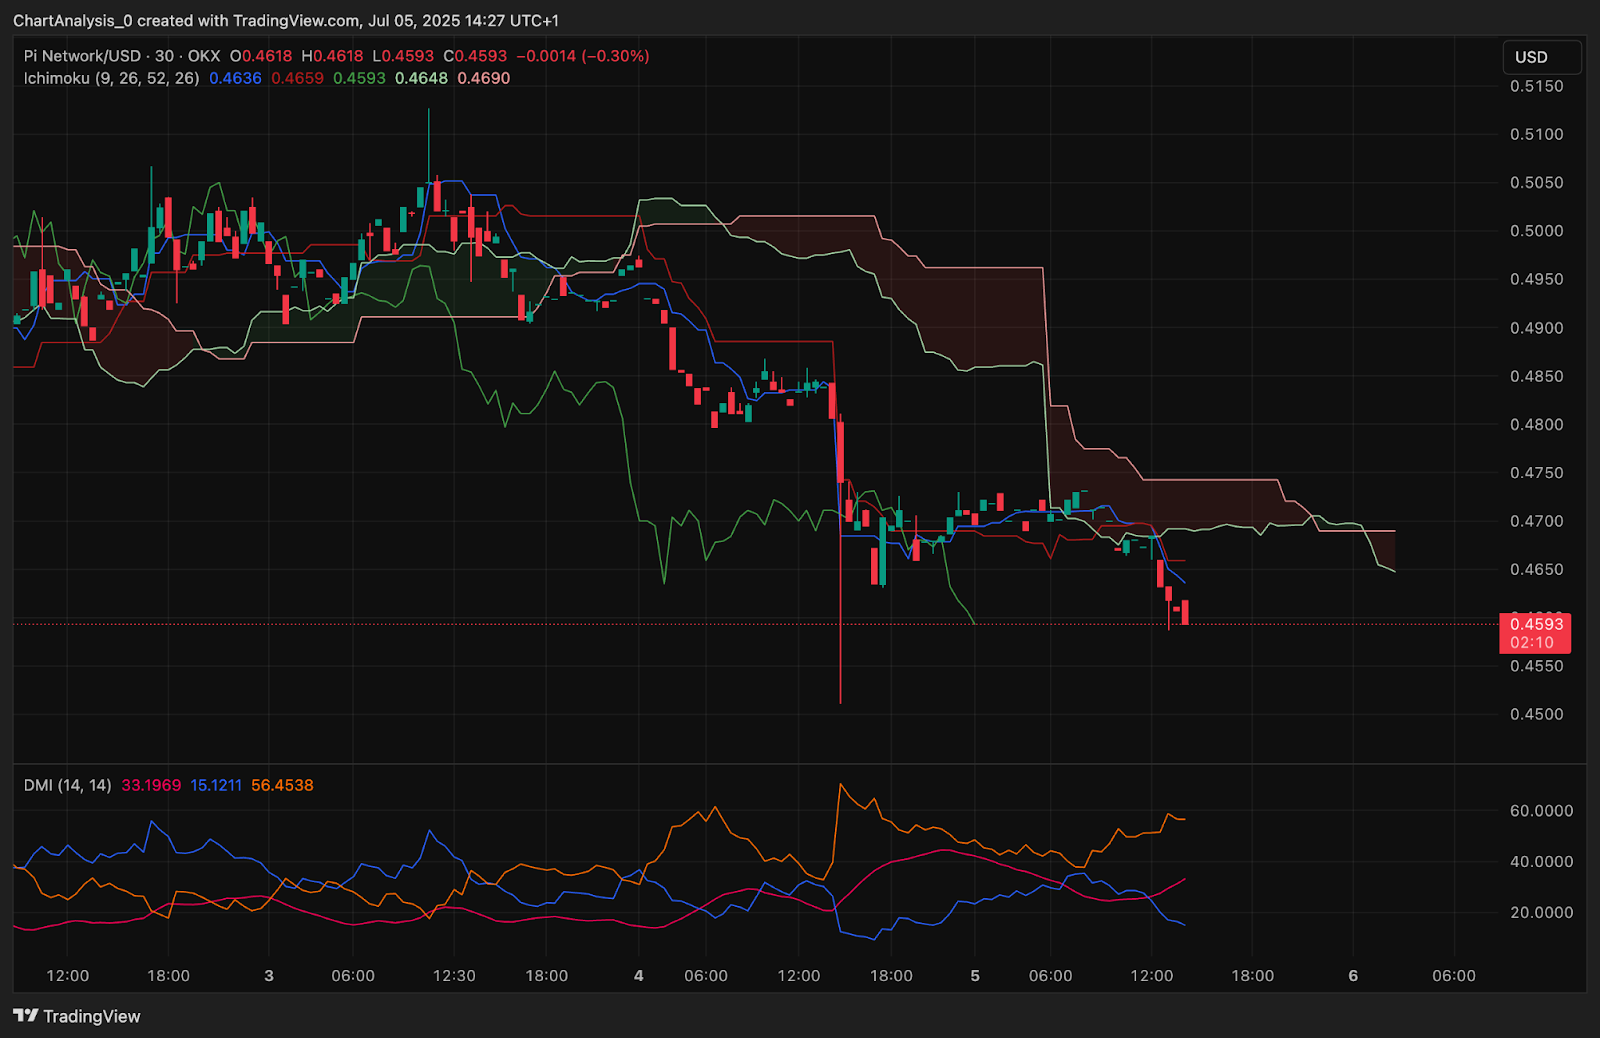
Pi Network price dynamics (Source: TradingView)
Ichimoku Cloud paints a grim picture: bears remain in control. The price flounders beneath the cloud’s oppressive shadow. Key lines, Kijun-Sen and Tenkan-Sen, resist a bullish embrace. Adding insult to injury, the Lagging Span trails below, a constant reminder of bearish dominance.
The Directional Momentum Index (DMI) seals the deal: a dominant -DI line lords over +DI, while a surging ADX, clawing towards 56, screams “bearish trend in full force!”
Price Indicators, Signals, Graphs and Charts (24h)
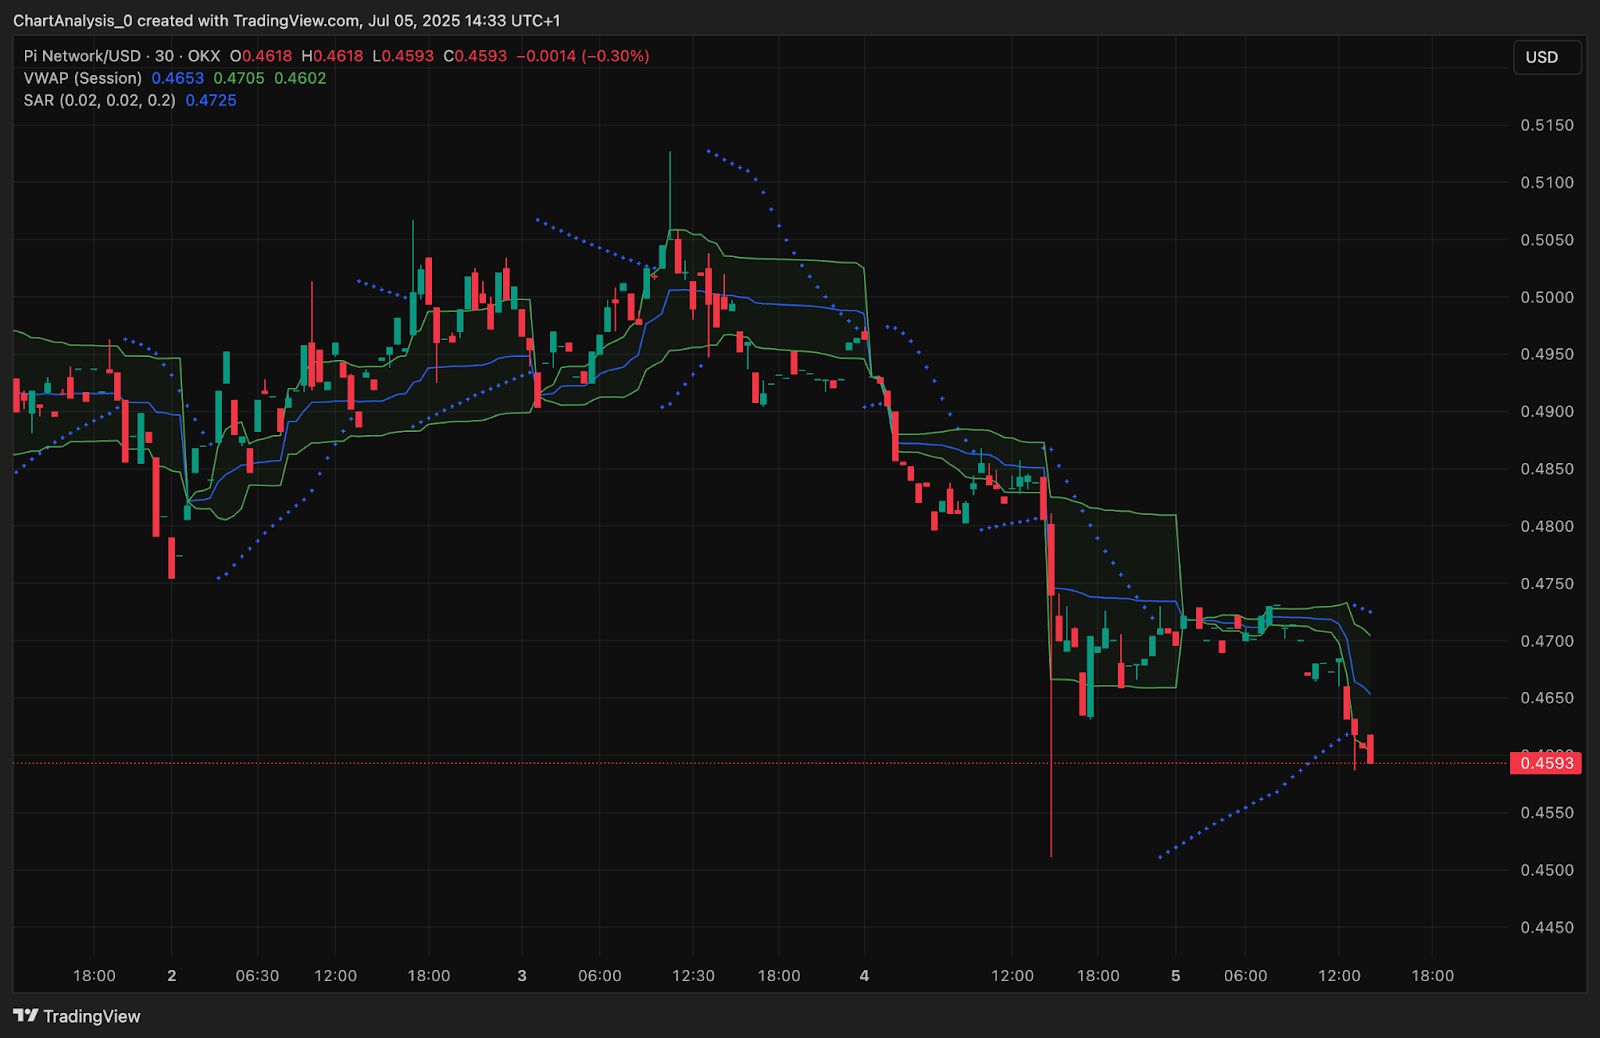
Pi Network price dynamics (Source: TradingView)
Bears are tightening their grip. The Parabolic SAR’s ominous dots hover overhead on the 30-minute, a clear sign that sellers are calling the shots. Adding fuel to the fire, VWAP looms large at $0.465, now a formidable wall blocking any bullish advance. Breaching that price point looks like an uphill battle.
Pi Network price dynamics (Source: TradingView)
Pi flirts with a breakout! Hovering at the precipice of a significant demand zone ($0.42-$0.46), Pi is testing the waters. This isn’t just any support level; it’s a historical fortress against sell-offs. Will it hold strong once more? Keep a close watch – a slip below $0.44 could trigger a rapid descent, drawing Pi into a liquidity vacuum around $0.40-$0.41. Buckle up, this zone will determine Pi’s next big move.
The 4-hour chart screams bearish. Balance of Power is deep in the red (-0.027), confirming the bears have a stranglehold on the market.
PI Price Prediction: Short-Term Outlook (24h)
Bulls need to conquer the $0.465–$0.470 barrier – a zone where the VWAP and EMA converge. Failure to do so paints a bearish picture. A fall below $0.456 could unleash a cascade toward $0.44, potentially plunging as deep as $0.407 – a critical demand zone and the next significant low.
If Pi Network’s price finds its footing and vaults past $0.470 with trading volume backing it up, keep an eye on $0.488 – that’s where the 20-day EMA is waiting to rumble. Blast through that, and $0.501, guarded by the 50-day EMA, becomes the next battleground. But beware: these levels are heavily fortified. It’ll take a serious surge of bullish power and a shift in market structure to break through.
For now, the setup favors cautious bears, while bulls must defend $0.44 to avoid deeper downside continuation.
Pi Network Price Forecast Table: July 6, 2025
| Indicator/Zone | Level (USD) | Signal |
| Resistance 1 | 0.470 | VWAP + Parabolic SAR zone |
| Resistance 2 | 0.488 | EMA20 dynamic ceiling |
| Support 1 | 0.456 | Weak low + demand edge |
| Support 2 | 0.407 | Liquidity target + prior BOS zone |
| RSI (30-min) | 39.9 | Bearish-moderate |
| MACD (30-min) | Bearish bias | Momentum fading |
| BB Width (4H) | Tightening | Precursor to breakout |
| Ichimoku Cloud (30-min) | Bearish setup | No bullish signal |
| DMI / ADX | ADX 56, -DI leads | Trending bearish momentum |
| BBP (4H) | -0.0274 | Bearish power dominance |
Investing involves risk. This isn’t a get-rich-quick scheme, and this information isn’t a magic money tree. We’re here to inform and educate, not offer financial advice. Think of this article as a compass, not a GPS. Coin Edition isn’t liable if your investments take a wrong turn after reading this. Do your own research, proceed with caution, and remember: every financial decision is ultimately yours.
Thanks for reading Pi Network Price Prediction For July 6 2025: Will PI Hold $044 Or Slide Toward $040 Amid Bearish Control?

