Related Articles

ChatGPT’s explosive rise has reignited Wall Street’s love affair with AI, tempting both amateur and seasoned traders to weaponize machine learning in their portfolios. But behind the hype, a murky truth lurks: While some firms loudly boast of their AI prowess, many whisper sweet nothings – their actual machine learning use is more mirage than method.
Machine learning: it’s not just buzz. Dive in carelessly, and you’ll be chasing fool’s gold – mistaking random noise for a real pattern. But wielded with precision, it’s a powerful lens. It can separate genuine market whispers from the echo chamber, and even sculpt the perfect buy/sell strategy from your most reliable indicators.
Unleash the power of Ridge Regression! This article cracks open a surprisingly simple yet potent machine learning technique, your gateway to algorithmic trading mastery. We’ll dissect the core mechanics, then dive into a real-world crypto backtest, exposing dazzling visualizations of buy/sell decisions, triumphant wins, and humbling misses. Prepare to witness ridge regression in action!
The statistics of backtesting
Trading isn’t physics. Statistics, typically used to unearth hidden relationships buried beneath random noise, often stumbles when applied to the market’s messy reality. Unlike scientific data, trading decisions are driven by human psychology and blindsided by unforeseen news. Backtesting, therefore, rarely provides a crystal ball for future profitability.
The exception? High-frequency trading. Here, algorithmic warfare can create fleeting, statistically detectable patterns. But even then, approach with a healthy dose of skepticism, practicality, and old-fashioned common sense. Don’t let the numbers blind you.
Linear regression
Linear regression: Machine learning’s gateway drug. Before diving into complex algorithms, this simple technique reveals if your market signals hold water. Think of it as a canary in the coal mine for predictive power.
One powerful approach? Feed it a sequence of recent price fluctuations (an autoregression) to forecast the next move. Intriguingly, even familiar strategies like moving average crossovers operate within linear regression’s realm. A crossover simply checks if a particular linear combination of past prices flips positive or negative. This means a well-tuned linear regression can unearth a far wider range of trading strategies, with the moving average crossover strategy being a specific case of this far wider range.
Next, amplify your historical price analysis by layering on your go-to indicators: moving averages that whisper trends, regression lines that chart the course. Want to get really sophisticated? Introduce signals derived from correlated assets – a sneak peek into the world of pairs trading and statistical arbitrage, where linked fortunes dance (but that’s a story for another time!).
So, your linear regression model is whispering hints about future price movements? Let’s turn those whispers into actionable trades. Forget passive observation; we’re building a trading strategy. Imagine a tripwire: when the model predicts a price jump exceeding a pre-set “buy” threshold, BAM! We’re in. Conversely, if the forecast plunges past our “sell” threshold, we short. It’s about capitalizing on conviction – trading only when the model shouts, not murmurs.
Ridge regression
Tired of trading strategies that crumble under pressure? Ridge regression, a clever twist on linear regression, acts as a powerful shield against overfitting. Deploy it and watch your models hold their ground, even when the market gets wild.
Imagine trying to draw a line through a scatter of data points. Linear regression finds the line that gets as close as possible to all the points. Now, imagine you want that line to be not just close, but alsosmooth. That’s ridge regression. It’s like adding a penalty for lines that are too jagged, forcing them to be simpler. The ‘alpha’ knob lets you decide how much smoothness you want to trade-off for pure accuracy.
Imagine tuning your trading strategy, tweaking dials for that perfect signal. But what if one signal, even with a massive boost, barely nudges your prediction needle? Standard linear regression, blinded by the slight improvement, might latch onto it, amplifying noise and potentially building your strategy on shaky ground. Ridge regression, however, acts like a seasoned trader, recognizing diminishing returns. It wisely shrinks the influence of that weak signal, keeping your strategy grounded and resilient against the seductive dangers of overfitting. A strategy that isn’t overfitted will perform much better.
A few technicalities worth mentioning
Before unleashing an autoregressive model, pause! Is your data telling a consistent story? We need “stationarity” a steady beat where mean and variance don’t wildly fluctuate. Think of it as ensuring your time series data isn’t a chaotic rollercoaster. The secret weapon? Differencing. By focusing onchangesinstead of raw values, you often transform unruly data into a well-behaved, model-ready dataset. So, difference first, predict later.
Want regression results that sing? Normalize your signals first! By centering them around zero (mean 0) and scaling them to uniform variance (standard deviation 1), coefficient sizes become instantly comparable. Spot the heavyweight influencers in your model at a glance – no more wading through misleading magnitudes!
In machine learning, we split our data into two arenas: a training ground where the model learns, and a testing ground where its mettle is assessed. This protects us from “overfitting” – when the model memorizes the training data’s quirks instead of learning general principles. But beware! Your model might still latch onto patterns present inbothtraining and testing data, patterns that vanish like mirages in the real world. Think of it like this: past performance isn’t necessarily an indicator of future results. Always have a ‘stop loss’ strategy in place to protect you when the market throws a curveball, defying the lessons learned from yesterday’s data.
Intraday data, like 1-minute bars, presents a unique challenge: overnight gaps. Sticking daily snippets together creates jarring jumps, potentially wrecking your regression analysis. Think of it like stitching together a quilt with mismatched pieces. While ignoring these jumps might seem okay for a quick peek at 1-minute data, it’s a risky shortcut. The real solution? Ditch the urge to predict those initial, gap-affected price moves. Instead of forecasting the first ‘n’ moves of the day, start your predictions from the (n+1)th move. This way, your regression focuses on the meat of the day, not the messy morning wake-up call.
Choosing the right trading data frequency – one minute, one hour, or one day – is a crucial decision. I lean towards shorter intervals, diving into the granular details. Why? Firstly, more data points equal more opportunities. Secondly, short-term movements often betray the tell-tale signs of algorithmic strategies, revealing statistically significant patterns ripe for exploitation. However, don’t discount the power of patience. Longer timeframes can expose sentiment-driven momentum and mean reversion plays orchestrated by the (often predictable) emotional swings of human traders.
Our strategy dances a delicate balance, guided by two key parameters. First, the alpha in ridge regression acts as a regulator, harmonizing prediction accuracy with coefficient size. Think of it as a sculptor, chiseling away extraneous noise by shrinking irrelevant signals towards zero. Second, the threshold dictates our trading trigger. It’s a tightrope walk: too high, and we’re paralyzed by missed opportunities and eaten alive by fees; too low, and the strategy drowns in a sea of unprofitable trades. Mastering these parameters demands experimentation, a careful calibration to unlock the strategy’s true potential.
Backtesting ridge regression on Crypto
With the introduction out of the way, it’s time to look at the results!
Unleash the power of Python and Ridge Regression to conquer the stock market! I built an automated trading strategy, fueled by data scraped directly from Yahoo Finance. Forget static charts – I’m visualizing the backtested results withlightweight_charts, giving you interactive, scrollable candlestick charts. Zoom in, analyze the trades, and dissect the performance.
Under the hood,sklearn'sRidge Regression is the engine, predicting market movements. But a word of caution: some crypto assets like BTCUSD and ETHUSD on Yahoo Finance can show flatline data, where open, close, high, and low are identical. Still, the power to backtest and visualize your strategy is undeniable!
Forget complex algorithms and endless data streams. We’re diving headfirst into a simplified trading experiment. Think of it as a playground, not a quest for the Holy Grail of profit. Our tools? The last ten price swings, and moving averages/regression lines across 5, 10, and 50 periods. Consider this the foundation. The real magic – crafting bespoke signals for ridge regression – is a journey for another time. One final note: When our strategy says “sell,” we’re boldly shorting the crypto. Though, tweaking it to simply sit on the sidelines is a quick flip of a switch.
“Imagine distilling an entire week into a vibrant mosaic of minute-by-minute insights, then holding the last day back – a secret weapon for testing our strategy.”
Forget predicting the future. The light blue line on these graphs? That’s our crystal ball, revealing thepotentialnext move using ridge regression. But here’s the twist: we’re not fortune tellers. Instead, we’re using that predicted move as a compass, pointing us toward smart trades. When that blue line spikes – surging above a certain level, either up or down – that’s our signal to jump in. Upward surge? Buy. Downward plunge? Sell. Think of it as riding the wave of prediction, not for accuracy’s sake, but for profit.
Forget p-values for a moment. Ridge regression offers a shortcut. It shrinks coefficients of useless signals, rewarding truly valuable ones with size. Think of it as a built-in relevance filter. Big coefficient? Likely a key player. Small coefficient? Probably just noise. It’s not quite statistical gospel, but for a rapid signal check, the coefficient’s magnitude speaks volumes.
Bitcoin BTCUSD
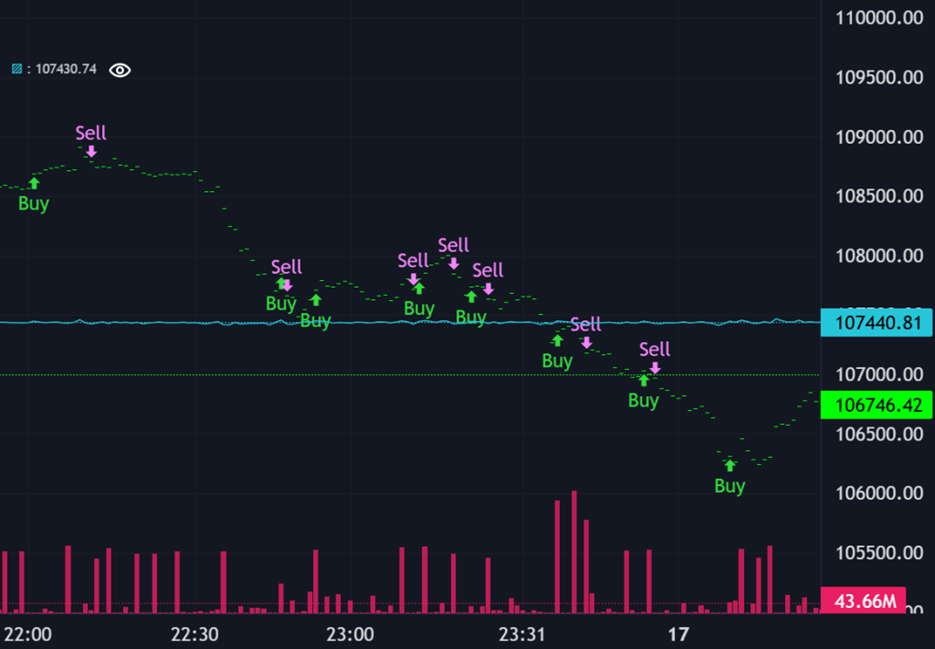
Ever wondered if you could outsmart Bitcoin’s wild ride? We put Ridge Regression to the test using a week of data (June 10-17, 2025) on the king of crypto. Forget crystal balls – this is about cold, hard data. Below, peek at the results: coefficients (scaled for clarity) revealing signal importance, and the ultimate showdown: strategy profit versus simply buying and holding. Did we beat the beast? Find out.
close_-10 = 0.00 close_-9 = 0.01 close_-8 = 0.00 close_-7 = -0.01 close_-6 = -0.02 close_-5 = -0.01 close_-4 = -0.02 close_-3 = -0.02 close_-2 = -0.00 close_-1 = 0.04 RegLine5 = 0.54 RegLine20 = -0.77 RegLine50 = -0.44 MovAvg5 = 0.56 MovAvg20 = 0.31 MovAvg50 = -0.21 Strategy profit = 412.19 Buy Hold profit = -437.32
Imagine a strategy that thrives when traditional buy-and-hold falters. The chart unveils its secret: Ridge regression acts like a nimble shepherd, selling during minor dips to shield your portfolio from the buy-and-hold’s inevitable losses. It’s not about predicting the future, but reacting intelligently to the present.
However, remember that different datasets might paint a different picture, potentially even showing our strategy underperforming compared to simply buying and holding. Zooming in on the coefficient sizes, the 5- and 20-minute moving averages, along with the 20-minute regression line, seem to be the key players. Interestingly, these regression lines and moving averages appear to hold more weight than the past ten relative price movements.
Ethereum ETHUSD
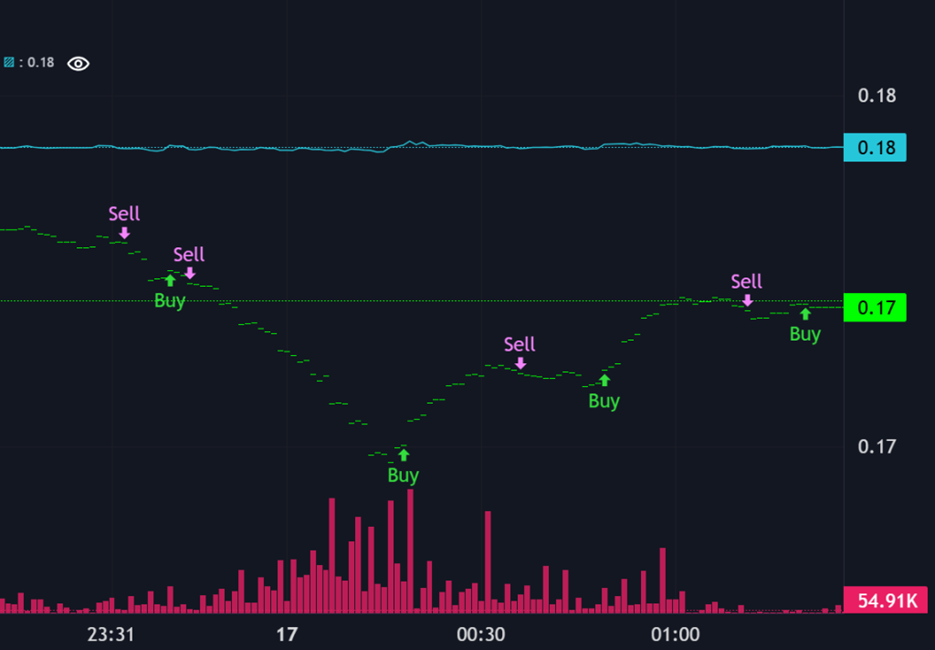
Next let’s try the ridge regression on the recent price data of ethereum.
close_-10 = 0.03 close_-9 = -0.00 close_-8 = 0.01 close_-7 = 0.00 close_-6 = -0.02 close_-5 = -0.03 close_-4 = -0.00 close_-3 = 0.01 close_-2 = -0.01 close_-1 = 0.08 RegLine5 = 0.74 RegLine20 = -0.63 RegLine50 = -0.90 MovAvg5 = -0.00 MovAvg20 = 1.37 MovAvg50 = -0.59 Strategy profit = 127.63 Buy Hold profit = -53.77
This strategy isn’t just better than buy and hold; it’s designed to profit even when the crypto tide turns. However and this is crucial don’t mistake current success for future invincibility. Every trading algorithm, no matter how sophisticated, has its breaking point.
To unlock predictive power, watch how the 20-minute moving average dances around the 50-minute regression line that’s where the magic happens.
Ridge Regression: Catching Market Waves. The chart reveals its knack for pinpointing prime buying opportunities at market lows and smart selling points at peaks. Caution: like any strategy, it’s vulnerable to manipulated data, and consistent success isn’t guaranteed.

DOGE (DOGEUSD)
Forget Wall Street’s battleground. To see if an algorithm can truly thrive, we’re ditching the crowded major indexes and diving into the wild west of crypto. Our test subject? DOGE. Let’s see if this underdog can unleash the algorithm’s full potential, where the giants aren’t watching so closely.
close_-10 = -0.00 close_-9 = -0.00 close_-8 = 0.03 close_-7 = 0.00 close_-6 = -0.02 close_-5 = -0.02 close_-4 = -0.02 close_-3 = 0.12 close_-2 = 0.09 close_-1 = 0.09 RegLine5 = 0.13 RegLine20 = -0.04 RegLine50 = -0.45 MovAvg5 = -0.22 MovAvg20 = 0.83 MovAvg50 = -0.27 Strategy profit = 0.0144 Buy Hold profit = -0.0044
Forget buy and hold. The real edge? A strategic dance between the 20-minute moving average and the 50-minute regression line. That’s where the market whispers its secrets.
“The charts sing a familiar tune: Ridge Regression, the virtuoso investor, once again orchestrates a symphony of strategic buying at market’s nadir and selling at its zenith.”
Conclusion
Imagine turning market noise into a symphony of profit. This article unveils a simple yet powerful machine learning algorithm that learns to trade cryptocurrency. Forget complex theories; we’re talking practical application. We built a basic strategy, using moving averages and regression lines as our foundation. The results? Surprisingly promising. Your next move? Think of this as a launchpad. Explore new cryptocurrencies. Add layers of trading signals. Tweak every parameter until you’ve crafted a strategy uniquely your own. The market awaits.
Even with the impressive results showcased here, remember this: no investment strategy is foolproof. There will be instances where this approach underperforms a simple buy-and-hold strategy. Imagine a market climbing steadily upward, but with short-term price swings. Our strategy, reacting to these oscillations, might buy and sell too frequently, missing the larger, more profitable upward trend. To combat this, consider fine-tuning the strategy’s parameters – the threshold, for example – based on current market volatility or the strength of the prevailing trend. A dynamic approach might be key to unlocking its full potential.
Genius Mathematics Consultants provides quantitative support to crypto traders and defi firms including algorithmic trading, derivative pricing and risk modelling.
Thanks for reading Ridge Regression – an Introduction to Machine Learning Strategies in Crypto Trading

