Related Articles

Sui (SUI) is coming back! After passing through crucial resistance, the bulls now rule the market and all technicals point toward an upward trajectory. Meaning, away with slow and steady; Sui’s charts plainly speak of a fast rise, with well-defined uptrends that have cropped up on the daily and hourly charts. Investors are buckled up with sights on the grand prize: breaking the $5 ceiling.
SUI Price Prediction: What Does the Daily Chart Say?
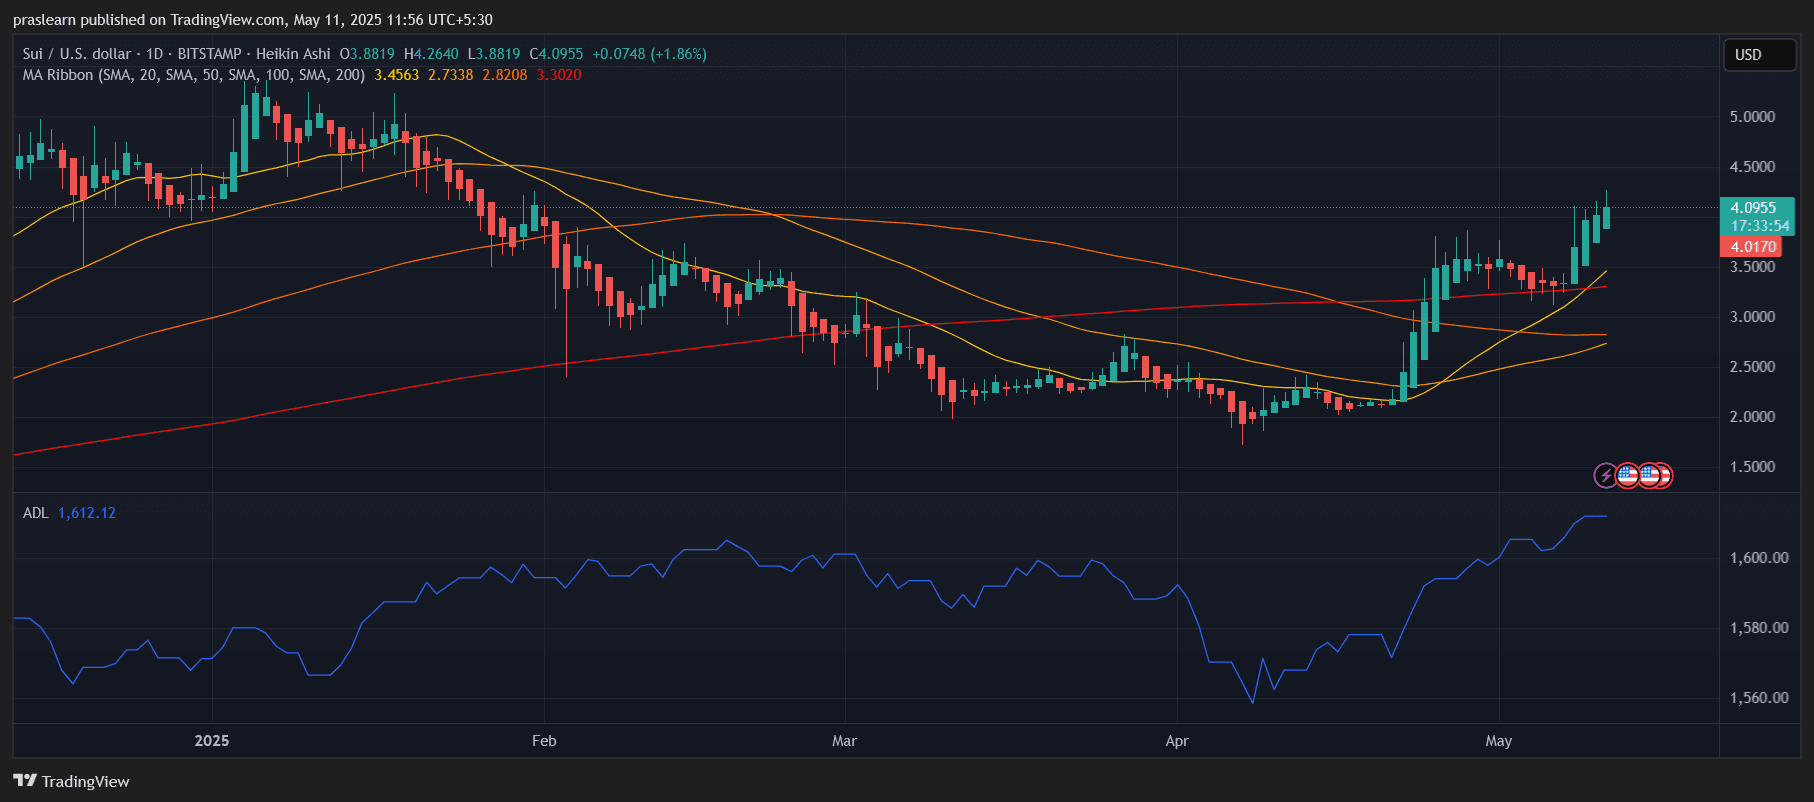
SUI/USD 1 Day Chart- TradingView
It’s shaping up to be SUI’s rally back in force! The bulls took charge after the price touched near $1.80 back in April. No sideways action here! Gone are the days when SUI was climbing past resistance and 50-, and 100-day moving averages. It’s showing strength aboveallprimary SMAs now. The 20-day SMA just crossed from below the 50-day, slotting right into a textbook bullish play on the charts. At a price of about $4.09, sustaining almost a 2% gain in a day, SUI has clearly broken from the $3.50-$3.80 resistance zone. Are we finally witnessing the beginning of a major uptrend?
Under the SUI price explosion, a covert force existed: the Accumulation/Distribution Line. The upward slant tells a story of increasing buyer conviction. This is not a speculative bubble; strong volume and relentless accumulation are instead fuelling the fire, turning a mere breakout into the possibility of an earth-shattering shift.
What’s Happening on the Hourly Chart?
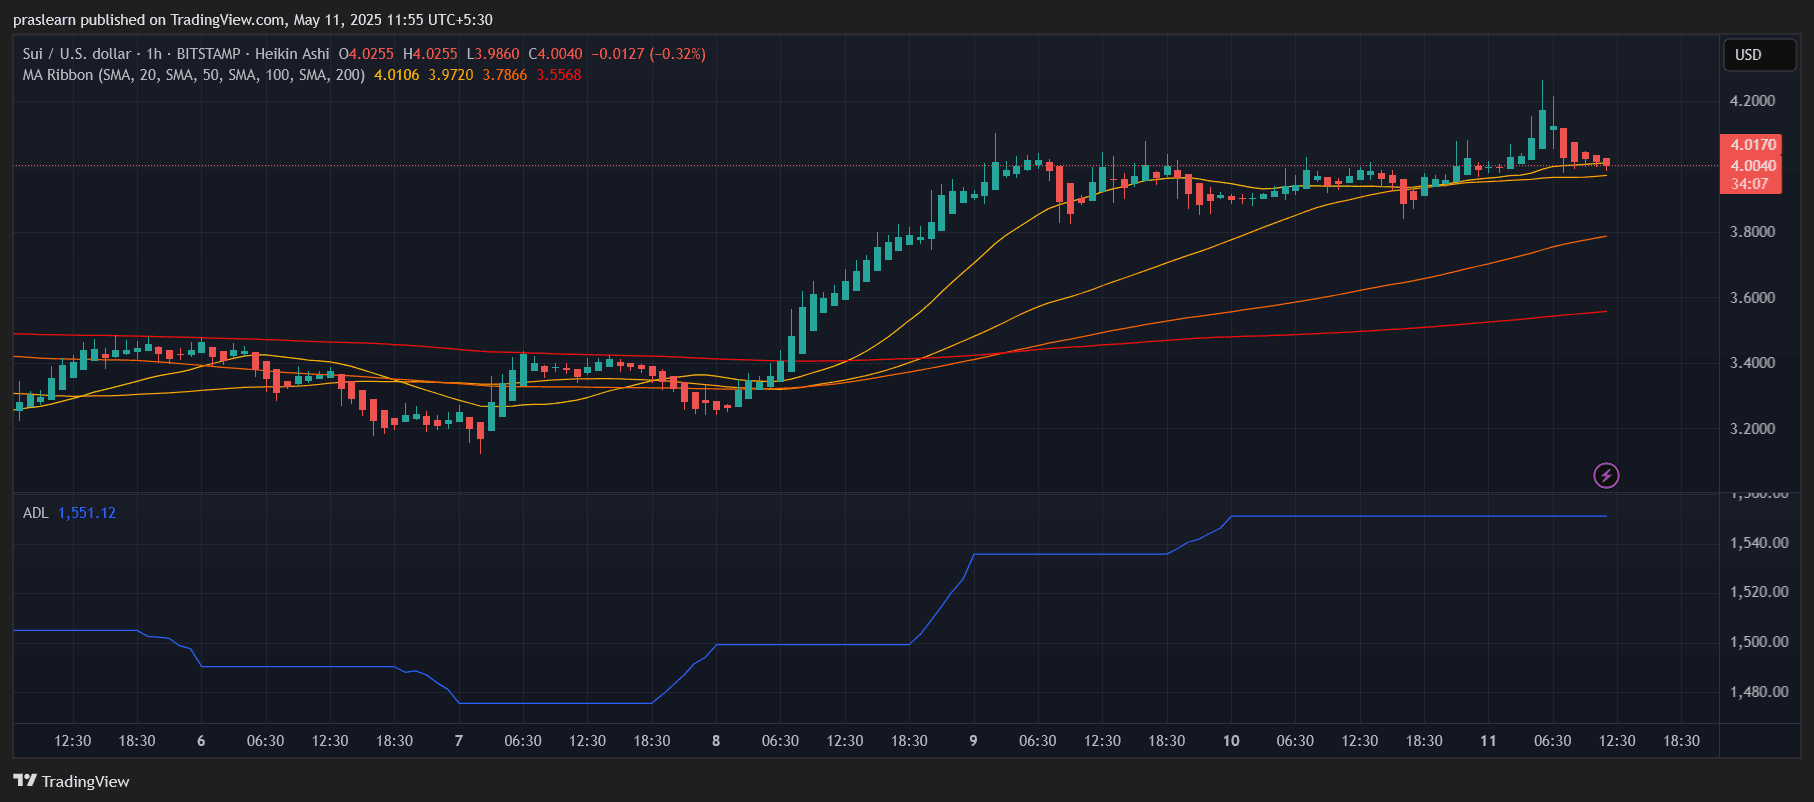
SUI/USD 1 Hr Chart- TradingView
SUI, on the hourly chart, says, “Liftoff!” The momentum took SUI price for a wild dance around $3.80 through an explosion which saw prices briefly shoot past $4.20 before taking a breather. The moving averages are in harmony, a perfectly stacked, bullish chorus composed of the 20, 50, 100, and 200 SMAs. The 20-SMA on the hourly went through a slight dip, but relatively, SUI is above it, perhaps indicating more fuel left for the rocket.
SUI price action is giving a signal for a bullish resurgence. Imagine sharks circling below and mercilessly snapping up everything at bargain prices: that’s what volume on green candles is telling us. Dips? Barely moving the ADL, it says it’s all buying. The $3.95 mark in the sand. Hold that line and SUI is ready to take off.
SUI Price Prediction: Will SUI Hit $5 Soon?
SUI is charging toward five dollars due to the technicals aligning and momentum building: That big round number is just a magnet. Expect a fight: $5 is a psychological barrier backed by January’s peak; the swing traders hold it in their sights while maybe some profit-takers circle. Bulls in charge? If the price got a fairly sustained bounce off $4.00, then a rapid push to $4.60 would immediately become the trade, so much so that the breakout run to $5 would take care of itself.
However, the bulls are clutching onto $3.80 for their dear lives. If this support were to fail should any break below $0.50 we might expect a pullback to 50-SMA around $3.30.
Final Thoughts
SUI is all set for liftoff! There is simply no talking about accumulation here; this one is merely setting off. Congestion from strong confluence zones of moving averages with a surge in buying pressure and the short-term chart turning bullish all have SUI pointing towards the skies. Provided the broader market cooperates against this, steady gains to the $5 regions are looking more tangible in the near term.
Thanks for reading SUI Price Prediction: Is $5 the Next Target After This Breakout?

