Related Articles

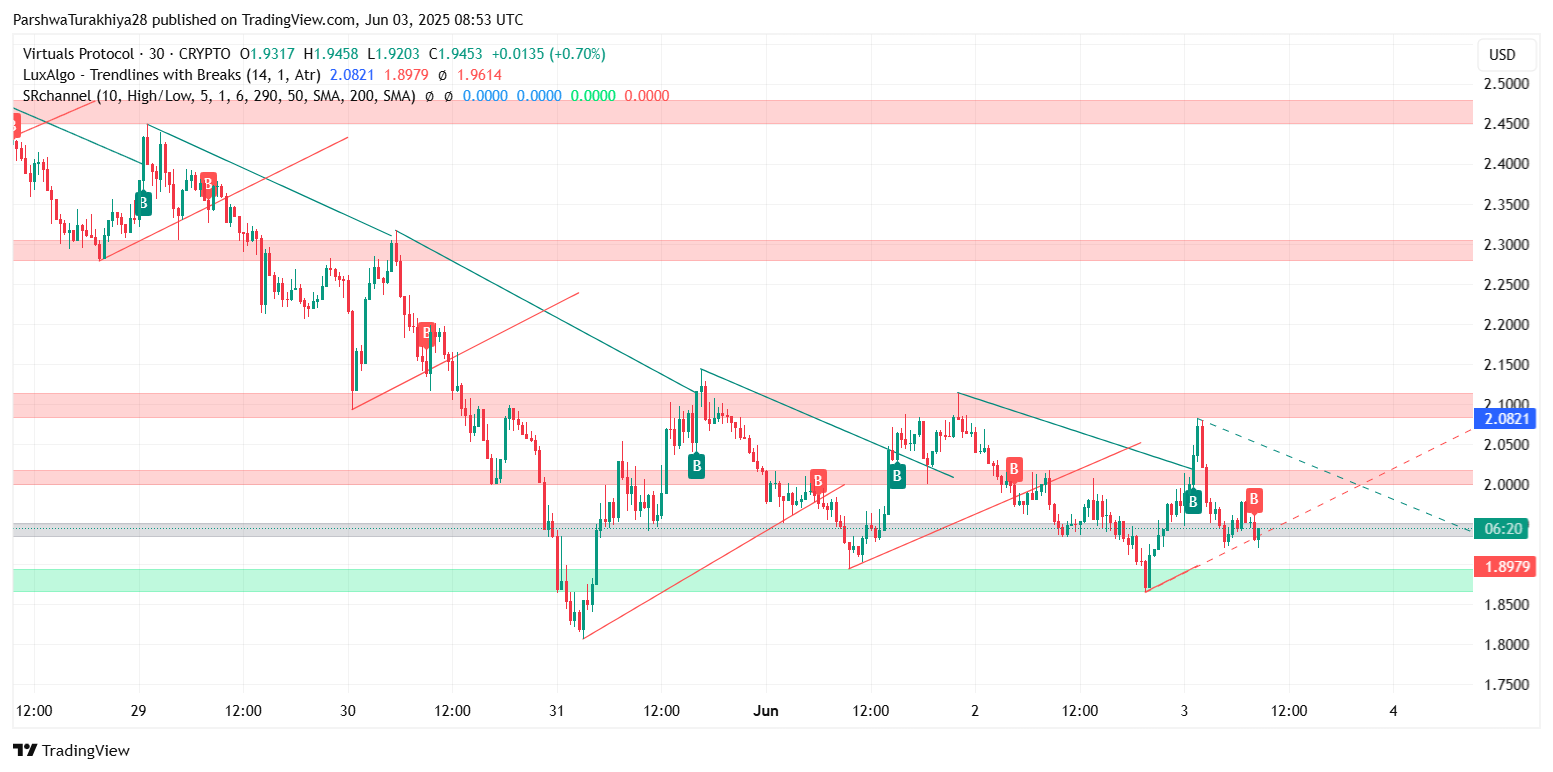
On a knife-edge, Virtuals Protocol dances. After an impressive rally, the price almost touched the $2.10 mark on June 1st, only to come back and now hold a level near $1.94 (June 4th). This slight drop hints at a weakening rally as a short-term support is attacked by sellers. Will it be a mere pause before another jump or the start of a deeper fall? In the days to come, we will know if the bears will grab the opportunity or if Virtuals Protocol will withstand this pressure and continue up.
What’s Happening With Virtuals Protocol’s Price?
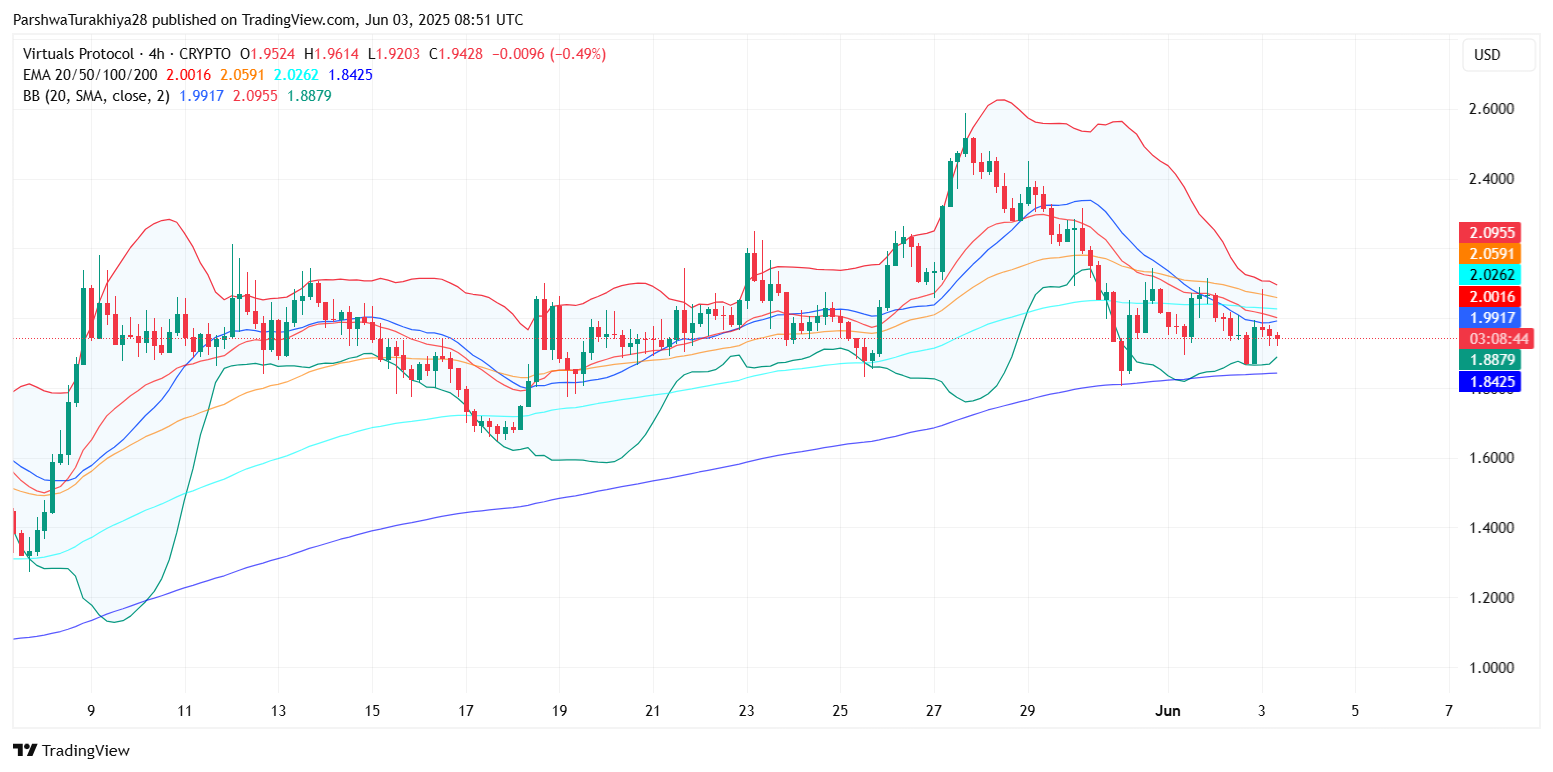
Virtuals Protocol price dynamics (Source: TradingView)
Virtuals Protocol: Bouncing wildly away from the $2.05 mark! But hold on-there may be an end to this! Multiple attempts to breach the $2.05 resistance met a brick wall and now it’s sliding back down. Just forget the 50 and 100 EMA lines-incidentally, the VP couldn’t even kiss them. What we’re looking at instead is the slow-motion crashing below these major levels on our 4-hour chart. What this translates to: that bullish charge may be in retreat and maybe we’re left in that gross no-man’s area potentially with bears shadow lurking around somewhere.
The rally of Virtuals Protocol failed spectacularly against stiff resistance levels set between $2.06-$2.10. The Bollinger Bands began to contract, indicating an impending price breakout. Having receded slightly, prices now flirt with a support level of $1.92-$1.95, once a higher level of contention in mid-May and now a crucial short-term pivot. Will it sustain or will volatility erupt?
RSI, MACD and Momentum Outlook
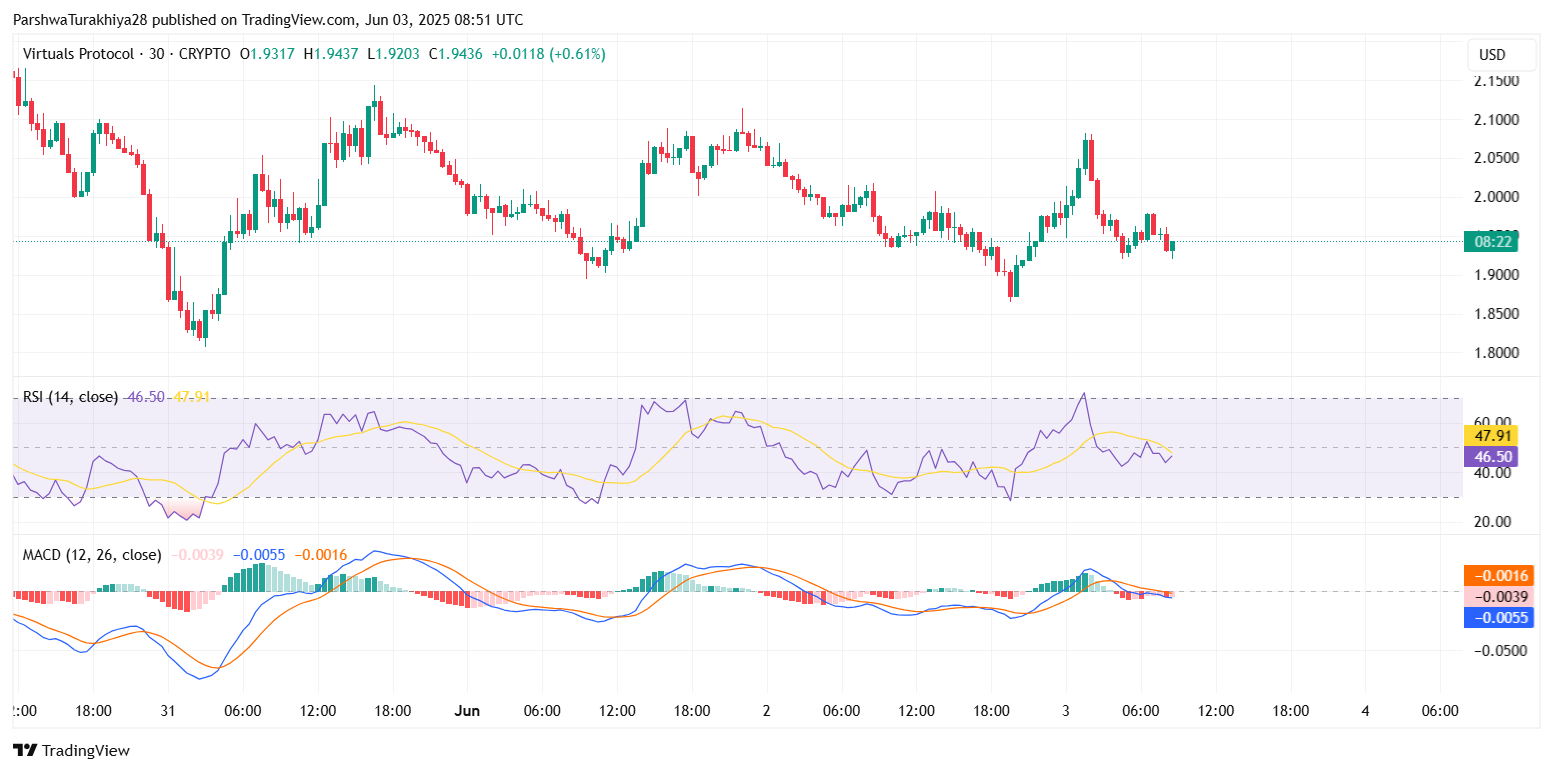
Virtuals Protocol price dynamics (Source: TradingView)
Virtuals Protocol is at a crossroads. The short-term momentum, which is best measured by the 30-minute RSI, stands paralyzed at around 46-47-a definite signal of indecision among traders. The MACD histogram, meanwhile, is shrinking, with its lines drifting towards an important crossover, thereby hinting at a reversal of the trend. This hesitation is echoed by a larger issue brewing on the 4-hour chart: a subtle, yet ominous, bearish divergence appears to be forming that might just see the bears seize the initiative.
The Stoch RSI goes below 20 on intraday charts, indicating that this rally is probably running on fumes. Exhaustion is near, while the signal for reversal hasn’t flashed yet.
Ichimoku and Trendline Insights
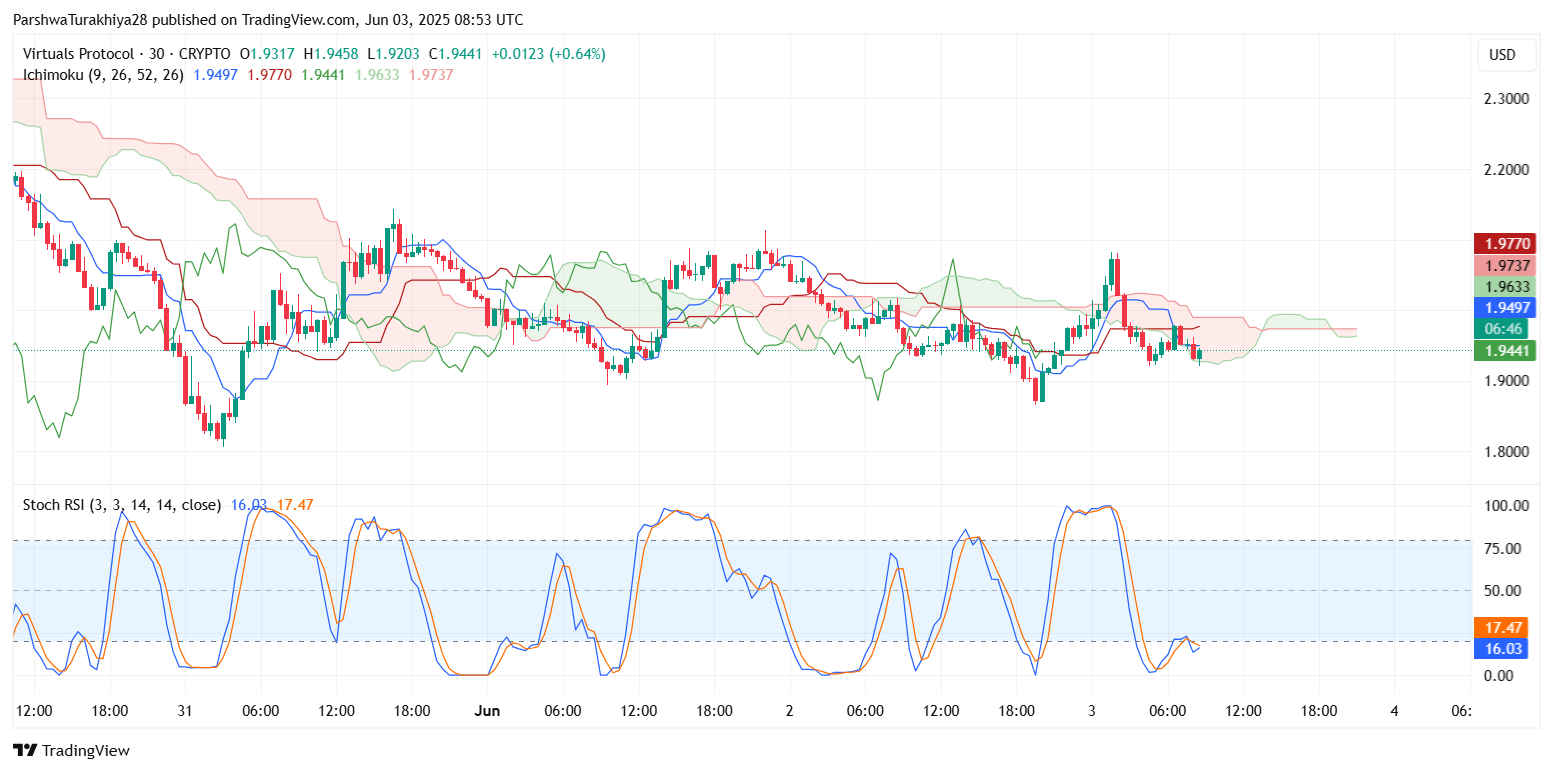
Virtuals Protocol price dynamics (Source: TradingView)
The Ichimoku cloud talks of hesitation here on the 30-minute chart. Price dances within its misty embrace, overshadowed by a flat Kijun-sen-silently predicting a breakout below. The Chikou Span reverberates with the stalemate, entangled with present price action, confirming a short-term market pause prior to a decisive leap.
The charts are screaming: something’s gotta give. Zoom in on the 4-hour and daily – false starts are visible; trendlines are twisting so tightly! This price has been coiled like a spring up against the trendline from the May 23rd low. $1.94 is the line in the sand. Break that, and it will be all hell.
Fibonacci and Long-Term Context
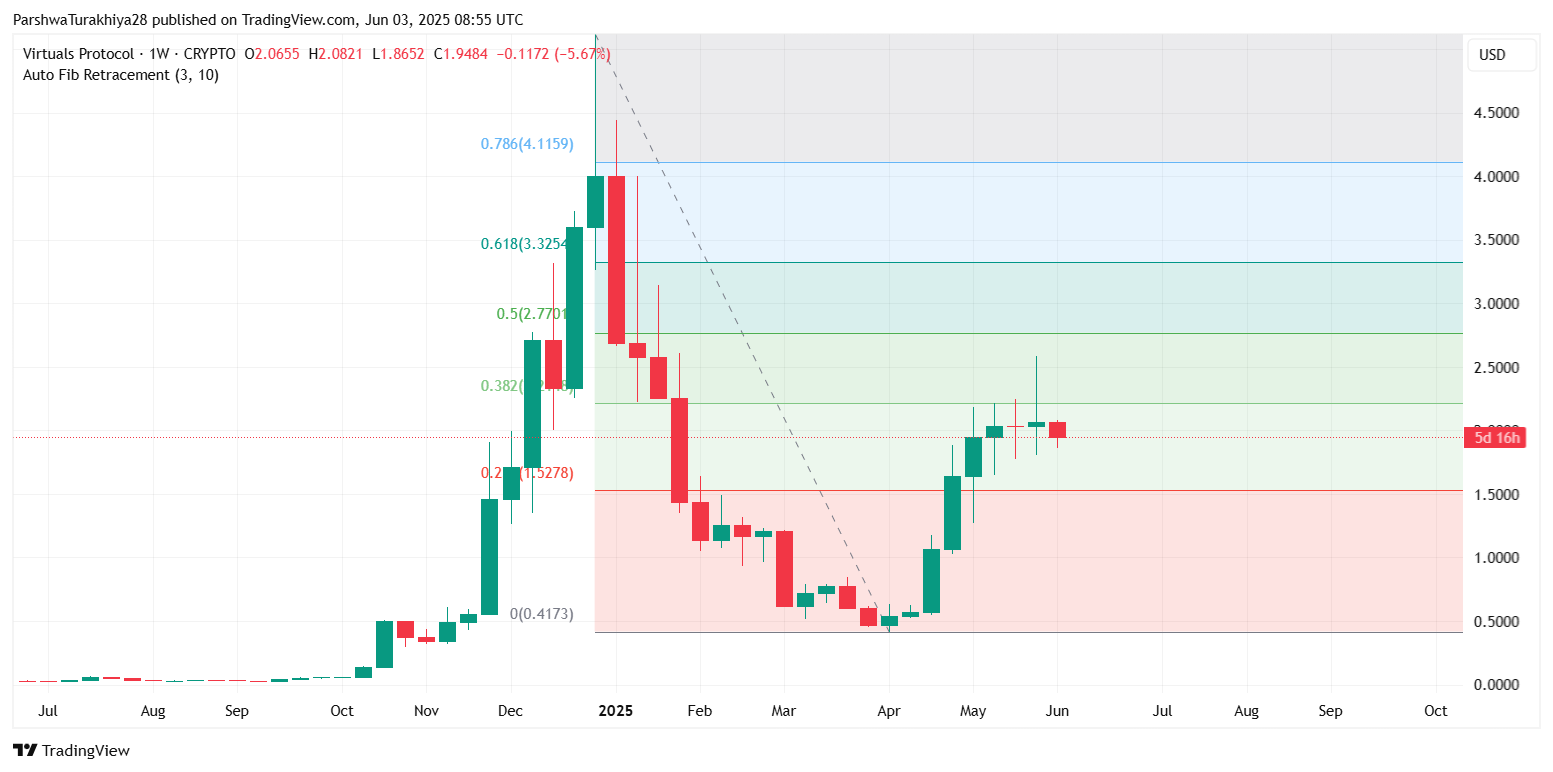
Virtuals Protocol price dynamics (Source: TradingView)
Zooming out to the weekly view, the price action of Virtuals Protocol has been hitting a tough wall. The Fibonacci retracements from the all-time high indicate a stubborn rejection of price near $2.18-the 0.382 fib level. The price has resisted any further recovery, with horizontal resistance reinforcing it. The bulls should take a step back and think twice: immediate support is down near $1.52-the 0.236 retracement level, while a weak safety net lies a little higher up near $1.84 in the 20-week EMA. Will it get through this price or will this resistance remain?
Why Virtuals Protocol Price Going Down Today
Virtuals Protocol price dynamics (Source: TradingView)
Virtuals Protocol price: The rejection at $2.05 spells misfortune. Multiple failures to climb above it just make it clear the sellers are aggressive, only further encouraged by a chilling atmosphere engulfing the sector. Momentum has come to a halt; Bollinger Bands are tightening as well. So, do not expect fireworks anytime soon.
“Whales are surfing on thin ice, hanging below the 1.94 mark off a slippery slope. To have control back into their hands, they must break the roof of $2.00; else, gravity will win.”
Virtuals Protocol Price Forecast: Key Levels To Watch
| Level Type | Price Zone |
| Immediate Resistance | $1.98–$2.06 |
| Breakout Confirmation | $2.10–$2.18 |
| Support Zone 1 | $1.90–$1.94 |
| Support Zone 2 | $1.84 (200 EMA) |
| Major Downside Risk | $1.72–$1.75 |
| Bullish Target (Short-Term) | $2.18–$2.30 |
Virtuals Protocol: Cooldown or Crash?
After a surge that came in the middle of May, Virtuals Protocol is either catching its breath or bracing for a larger dip. The key level is $2.05; a failure to reclaim this zone could send the price tumbling towards $1.84.
“Momentum” indicators are warning one with precaution, speaking of a possible bearish turn. Technical patterns revolve around an increasingly tight trading range, like a spring being coiled and ready to release.
Is this going to be a powerful jump, at the same time a decrement? It is only possible with some decisive activities that quite directly disclose the upcoming potential big explosion at the Virtuals Protocol.
Headsup:This is an inprinciple statement issued for educational and informational purposes. It must be taken as food for thought and not marching orders for investments. Coin Edition takes no responsibility for any investment decisions made on the basis of the abovementioned content; do your own research and be cautious before getting involved with any company mentioned herein.
Thanks for reading Virtuals Protocol (VIRTUAL) Price Prediction for 4th June 2025: Can Bulls Reclaim $205 or Is More Downside Likely?

