Related Articles

XRP claws back to $2.15 after a nail-biting drop to $2.10. Bulls stand firm, fiercely protecting a vital-demand zone like a dragon guarding its hoard. Is this a phoenix rising from the ashes of last week’s carnage, or a shallow pause before another plunge? Momentum indicators, however, are implying a cautious “maybe,” adding another facet to the intrigue of the standoff. The market is holding a deep breath, waiting for XRP to make its choice: breakout or breakdown?
What’s Happening With XRP’s Price?
XRP price dynamics (Source: TradingView)
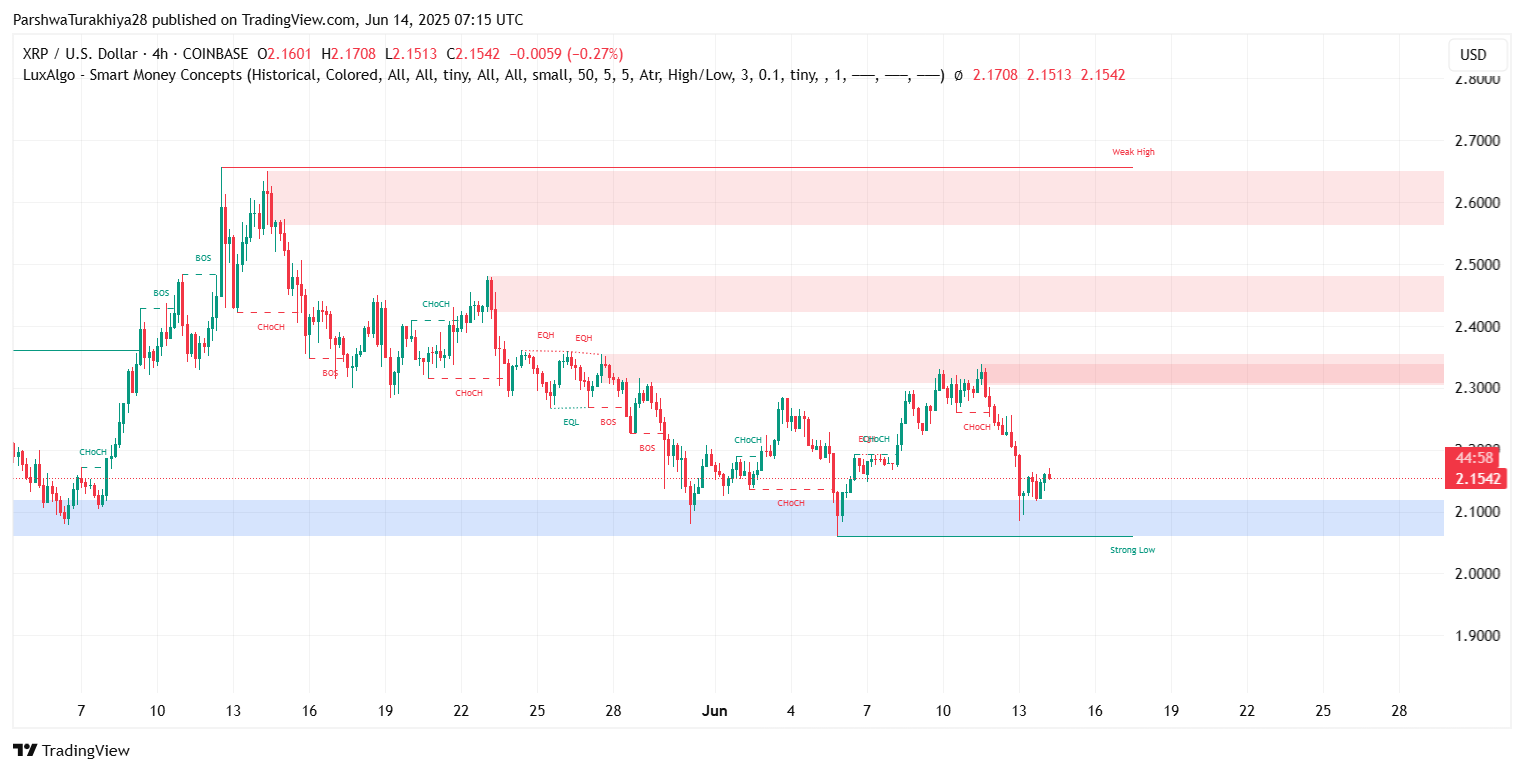
A daring comeback is being staged by XRP’s price. After a whirl of volatility, a solid support level has been established, providing a bounce between $2.06 and $2.10 confidently. This is no mere support; Smart Money Concepts charts are screaming “Strong Low” and a multitude of CHoCH signals – an indication for bullish momentum. This area has made XRP literally jump into the sky at least once before and is holding firm in its current state, ready to give another push.
XRP price dynamics (Source: TradingView)
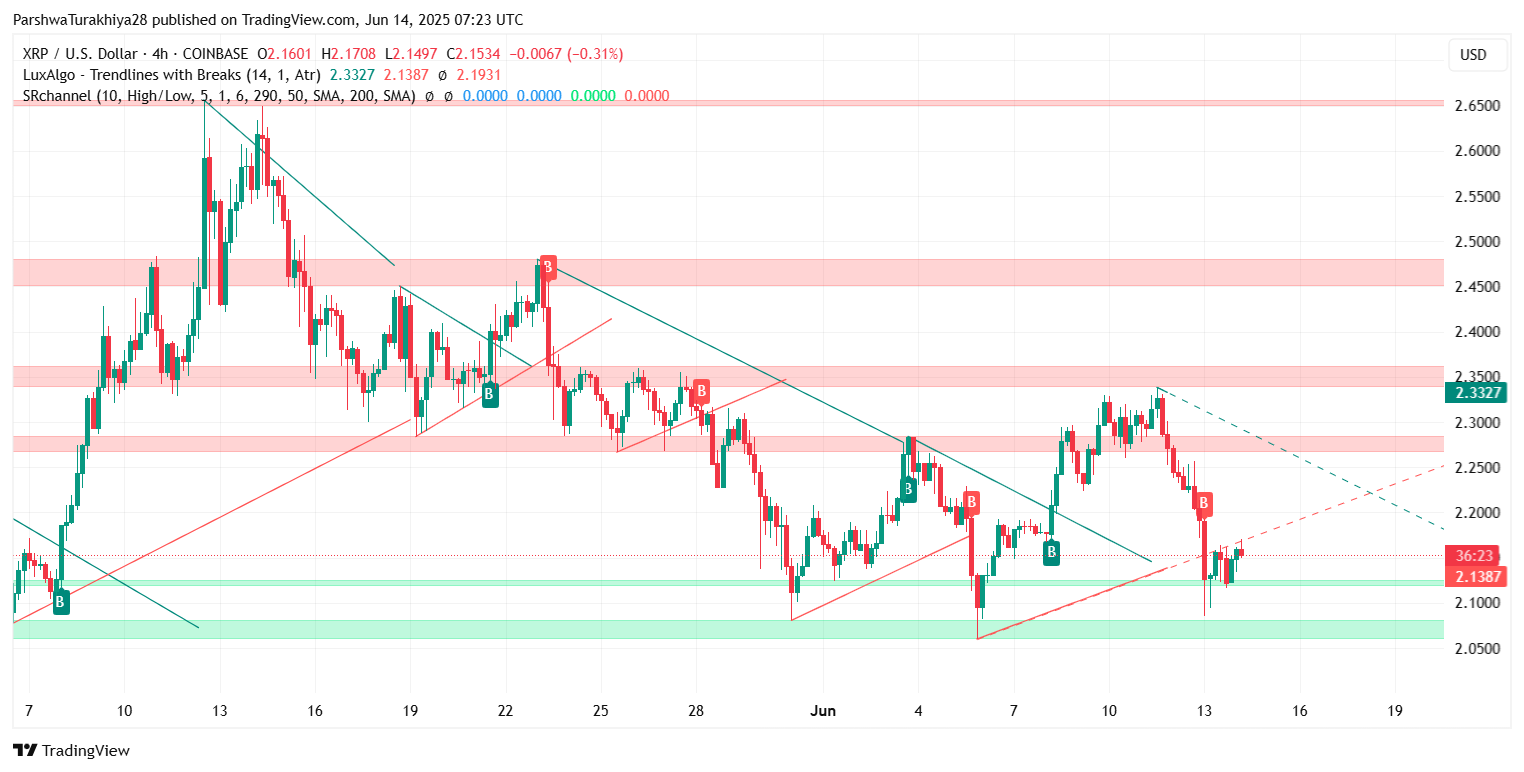
The 4-hour Liquidity swing chart tells the tale of titans battling near $2.08-$2.10. Some institutional-buying may have been strategically defending against a wave of selling at these levels. Presently, price action has been coiling just below the $2.18 resistance, erected by some stubborn sellers. This level corresponds exactly with the recent trendline rejection on both 30-minute and 4-hour charts, providing a double confirmation that either could lead to a breakout or a severe retracement.
Key Indicators Show Early Signs of Reversal
XRP price dynamics (Source: TradingView)
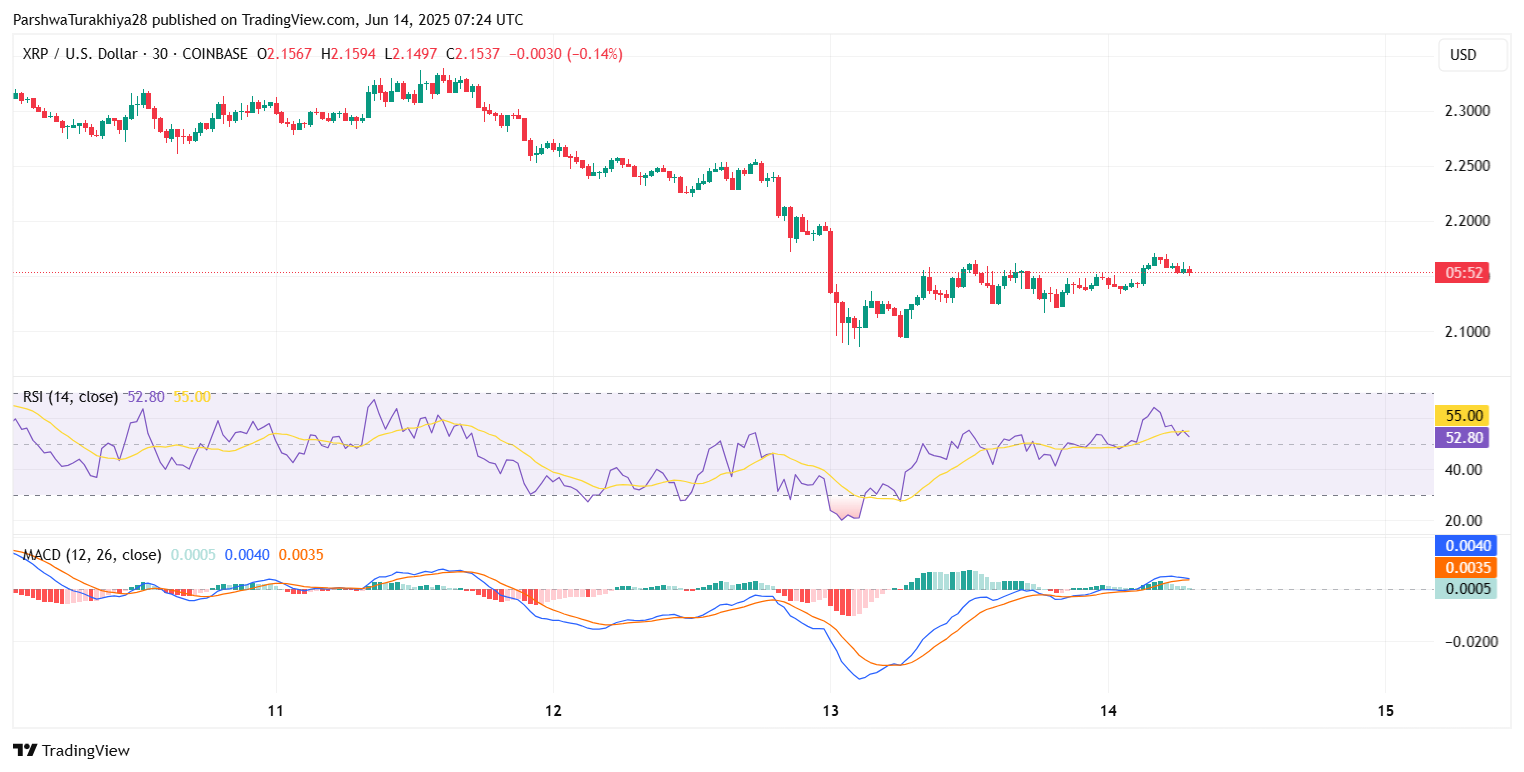
So maybe the bulls will tiptoe back into the arena! The 30-minute RSI is now at 52.80, clawing out of the oversold area. MACD has given a green light a weak bullish signal of momentum accumulation. Short-term buyers are indeed awakening; will this be just a blink… or a rally?
XRP price dynamics (Source: TradingView)
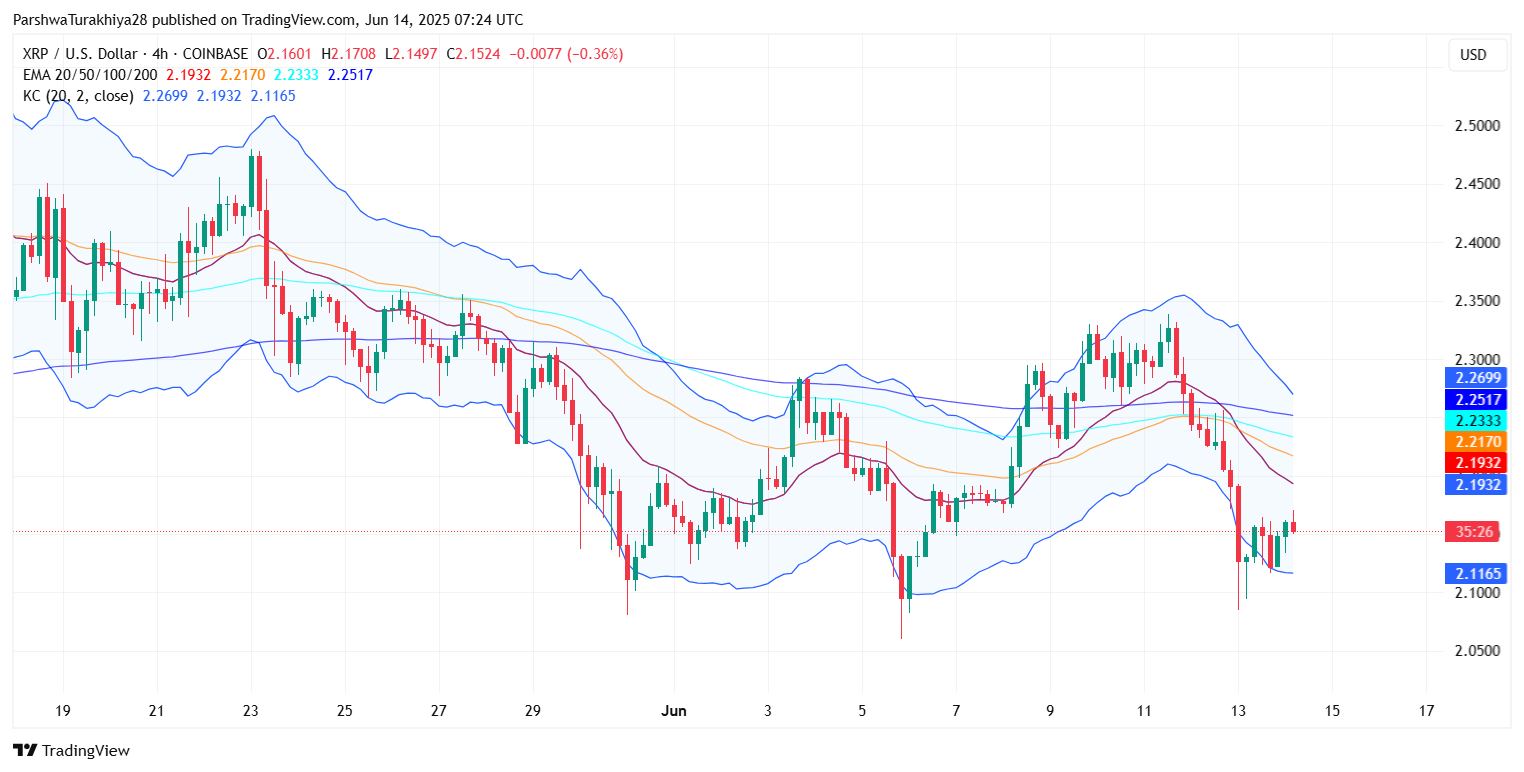
Bears are in front of gates! A strong resistance wall is seen on the 4-hour chart overhead from $2.19 to $2.25. The Keltner Channels, stacked with an EMA cluster (20, 50, 100, and 200 periods) on top, are layered defense mechanisms, choking any bullish attempt. The Keltner midline is crucial at $2.19; it aligns precisely with the wreckage of a preceding trendline breakdown. Eyes are glued to this confluence zone-the next few sessions might delineate if bulls overcome this fortress or face another harsh rejection.
XRP price dynamics (Source: TradingView)
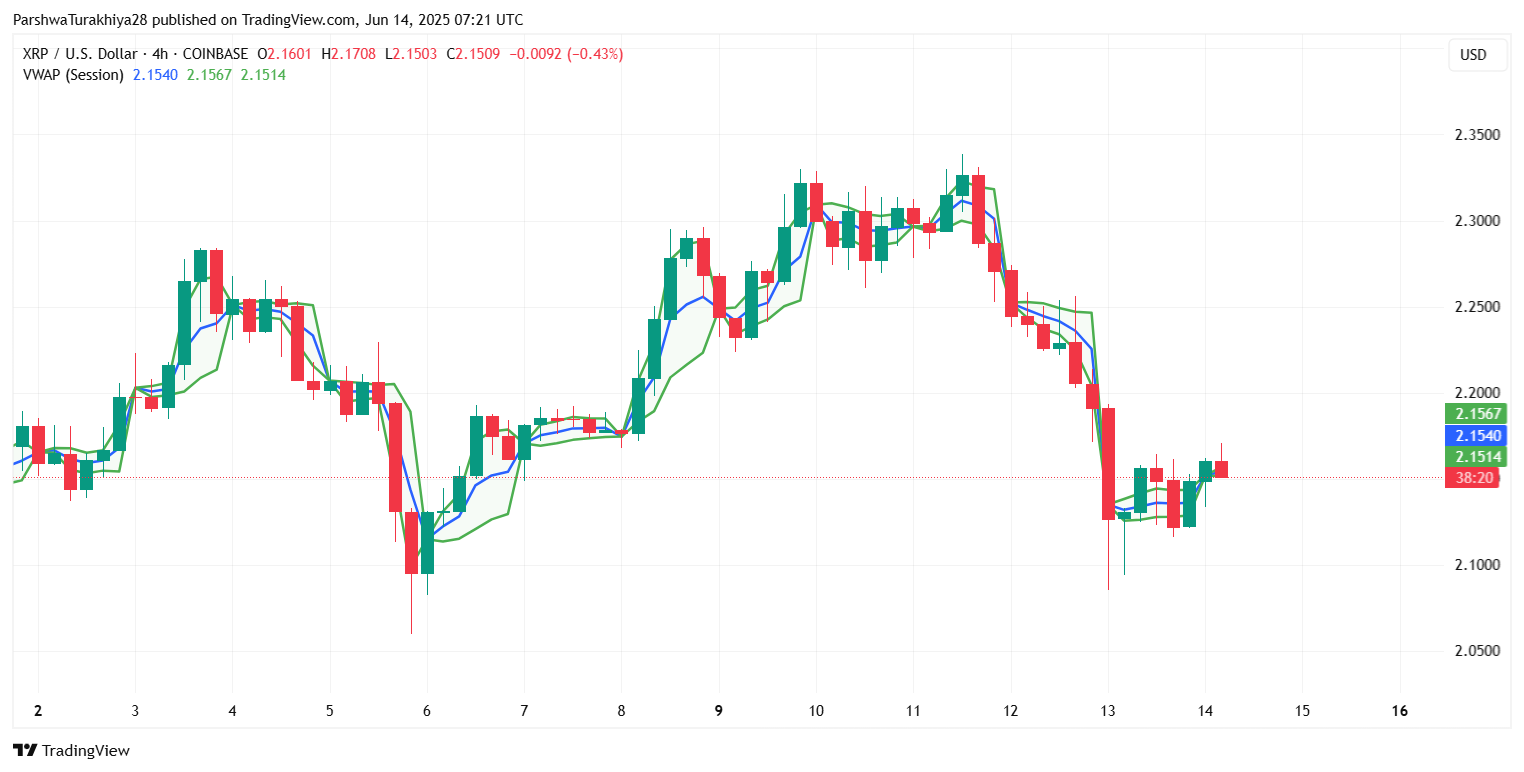
XRP stands on the edge of a bullish precipice.Unlike $2.15, VWAP stands at a magnetic value drawing the price to its orbit during a session. Can XRP challenge $2.18? A bullish break-out above this level would set sights onto $2.23-$2.25 for the ensuing rally.
Volume Profile and Market Structure
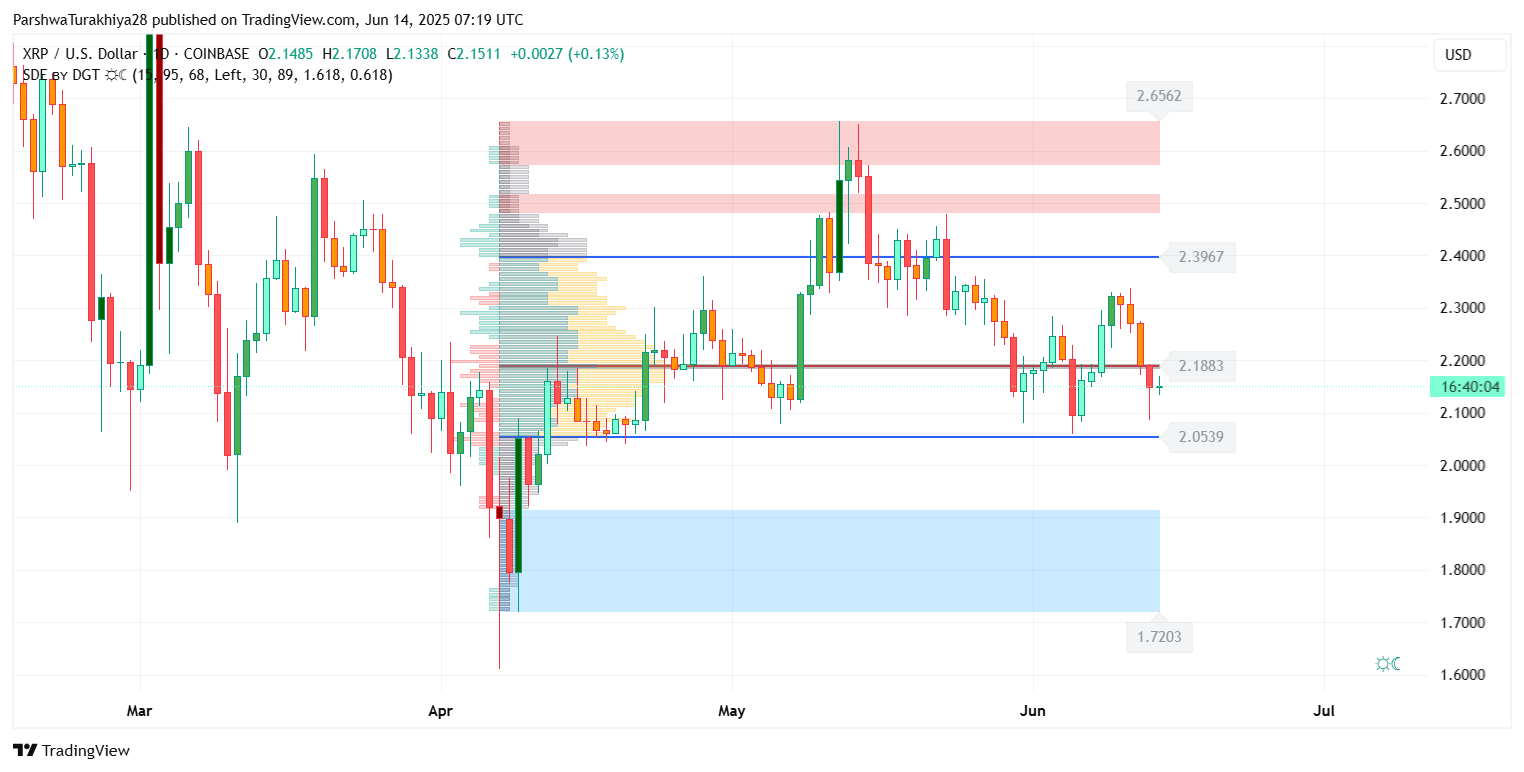
XRP on the daily chart is screaming for a showdown. According to a volume profile analysis, $2.18 is more than resistance; that’s the Point of Control-a battleground soaked in trading volume. The zone between $2.18 and $2.40? Think of it as a pressure cooker filled with old trades and failures. If XRP should dare test those old levels again, fireworks are sure to ensue. Volatility will explode.
XRP price dynamics (Source: TradingView)
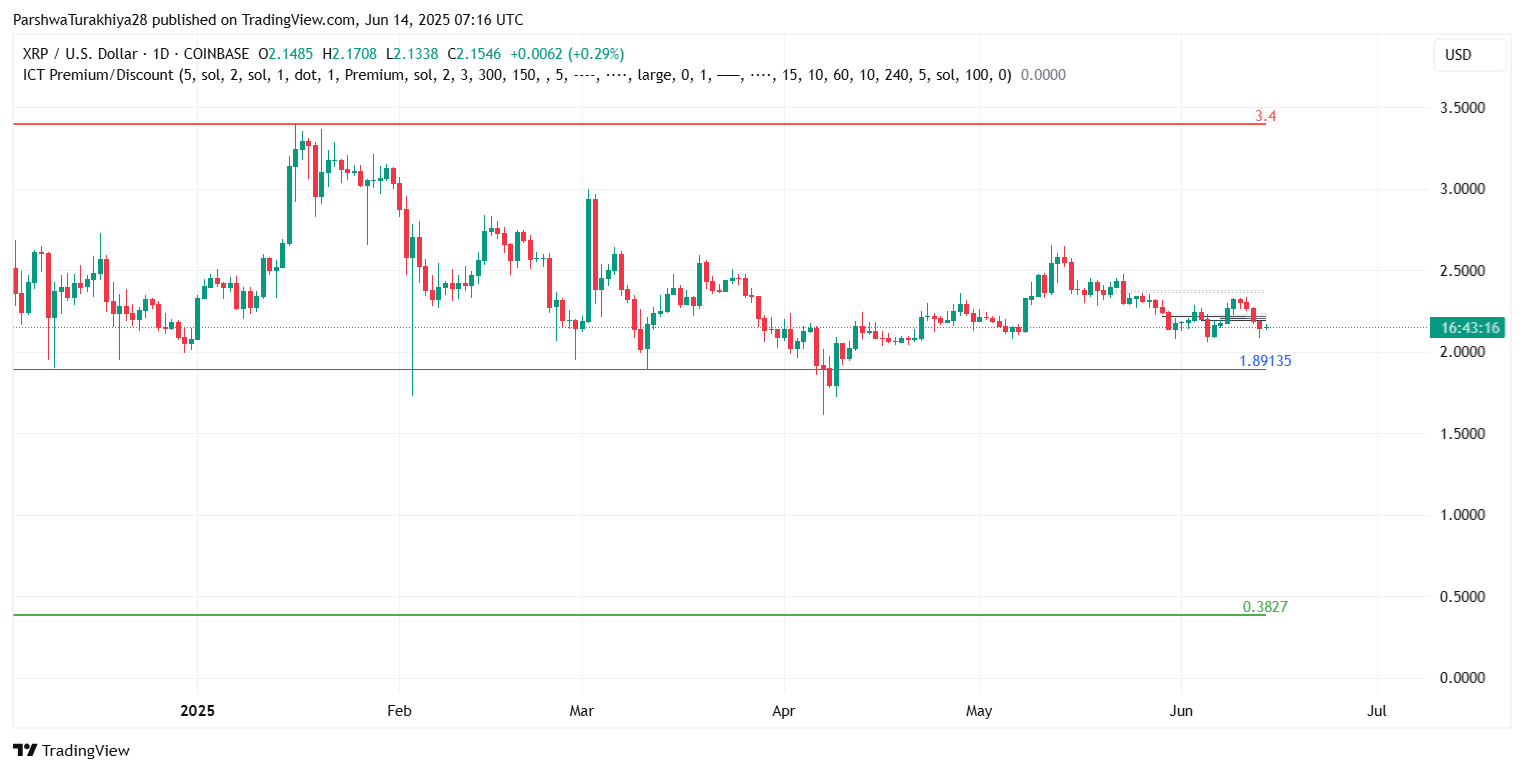
According to the ICT Premium/Discount model, XRP’s price is currently involved in a tug-of-war. It can be regarded as a coiled spring, stockpiling potential energy as it rests in neutral territory. The big breakout zones? A lofty $3.40 beckons from the top, while down below $0.38 screams discount territory. Watch $1.89 closely; that’s the last line of defense, the psychological barrier bears are dared to break through and send XRP tumbling further.
The Smart Money Concepts chart remains ambiguous in its indications. A multitude of Break of Structure (BOS) and Change of Character (CHoCH) signals points to a market finding it hard to establish itself. Nonetheless, the most recent bullish CHoCH at around $2.10 provides a glimmer of hope as a potential base camp for an extended upward climb.
Why is the XRP Price Going Down Today?
XRP price dynamics (Source: TradingView)
Price of XRP is under pressure, and there is a triple threat weighing the stock down. First, resistance is significant. Second, the bullish energy generated last week is now fading like a wet firework. And third, that last bounce back never was strong enough. Buyers jumped in around $2.10 to support the finish, yet XRP continues to remain caged under a trendline ceiling from June 7. Will it manage to break this lockdown or will it be weighed down under pressure?
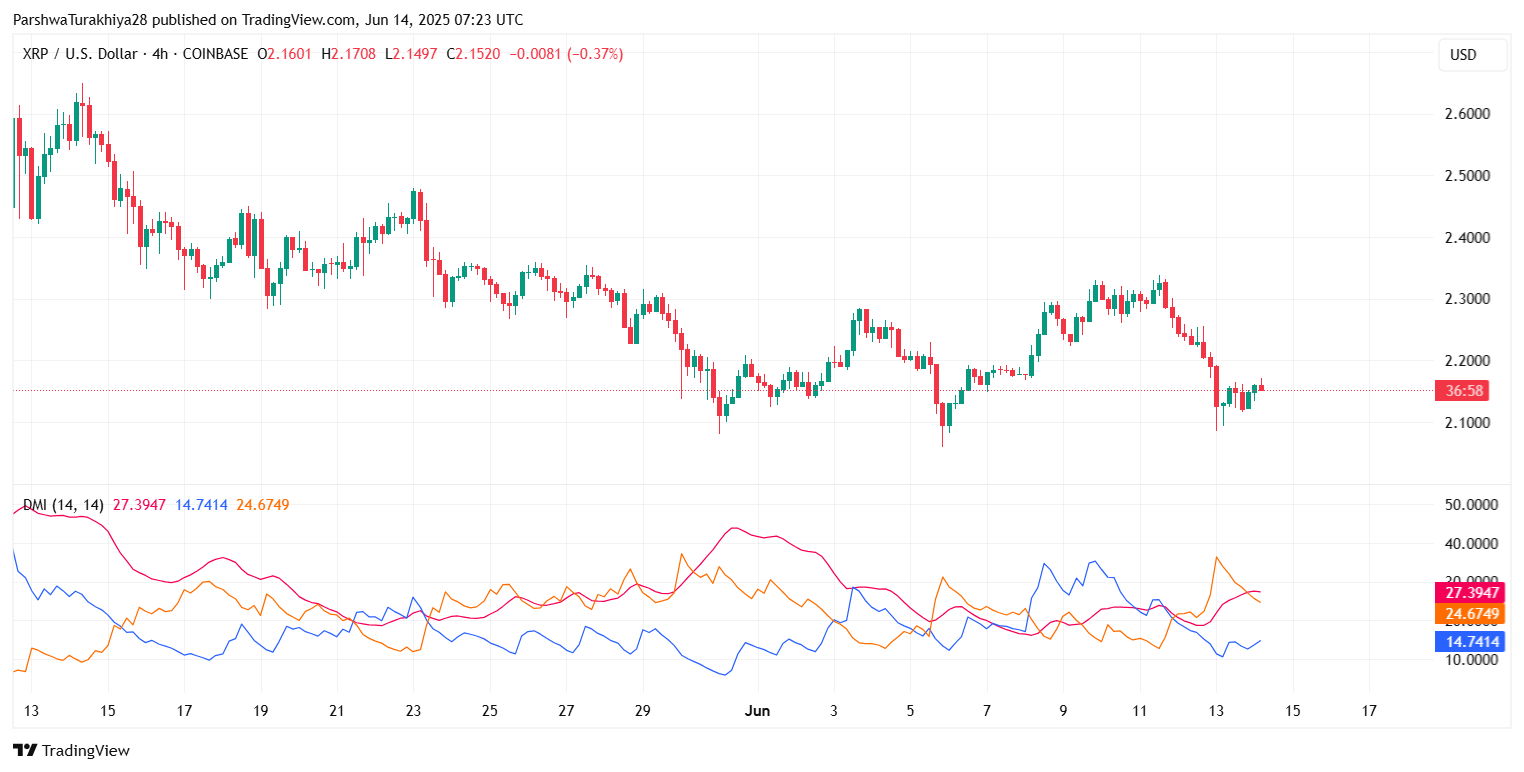
The bulls are testing the waters (+DI 24.67), while the bears still occupy high grounds (-DI 27.39). This tug-of-war forebodes a critical stalemate: trend reversal still eludes short-term traders caught in whirlwind indecision.
It is a price tug-of-war for XRP. The bulls have to beat the $2.23-$2.25 area to hold above the VWAP and mid-Keltner line. So those will be brief breaks of upward movement, mere blips in the overall downtrend and fast to fade away as and when they appear.
Short-Term Forecast and Price Outlook
XRP price dynamics (Source: TradingView)
XRP is tightrope walking. In spite of the brief rallies, the 4-hour chart seems to scream downtrend. Now, bulls, the mission is to smash through the $2.25 fort. Once over there, it can be a real reversal with the way set to challenge the $2.33-$2.39 strongholds. Until then though, buyer beware.
XRP’s gains seem to be losing steam! With resistance proving to be a high hurdle, it seems like the price might drop towards $2.10 or, even worse, extend its dip further to scrape liquidity around the $2.05-$2.06 range. Look below – critical support lurks right around $1.89, whose breach will cause grave concern.
Technical Forecast Table
| Indicator/Zone | Level/Signal |
| Immediate Resistance | $2.18 – $2.23 |
| Strong Resistance Cluster | $2.33 – $2.39 |
| Key Support Zone | $2.05 – $2.10 |
| Weekly Support Floor | $1.89 |
| RSI (30-min) | 52.80 (neutral-bullish) |
| MACD (30-min) | Bullish crossover |
| VWAP | $2.1540 |
| Trend Bias (Short-Term) | Neutral to Bullish |
| Volume Profile POC | ~$2.18 |
| DMI Trend Strength | Bearish bias holding |
At the intersection of the $2.23 mark lies the destiny of XRP. Crossing this barrier could unleash bullish forces, whilst failing to cross it makes for relentless selling pressure. Keep working that hawk eye of yours while watching for the trading volume with the RSI dancing on those key resistance points; they will help disclose whether or not the momentum upward has any staying power or is just doomed to be an illusion only for a while.
Heads Up!This should be your guiding light, not captain’s orders. This article is just for the curious heart; it does not constitute financial advising. Think of us as your friendly guide who shares insights, not one who provides investment strategies. Coin Edition bears no responsibility if you follow this content and hit rough seas. Make sure you do your own research and raise the sails of due diligence before setting sail.
Thanks for reading XRP price prediction for June 15 2025: Bulls defend $210 base as XRP eyes breakout above $218 resistance

