Related Articles

With a retracement, XRP now finds itself on the edge at the abysmal price of $2.19, after a spirited rebound from the trenches of $2.00. The price is doing its dance just below an immense wall of resistance, while tugged back and forth in the ocean of a broader consolidation area. The short-term indicators whisper violently ambiguous signals-no definitive direction is given, so the question must still be asked: will the bulls continue their rally, or will the bears snag the price for a bearish correction? The traders hold their breath.
What’s Happening With XRP’s Price?
XRP price dynamics (Source: TradingView)
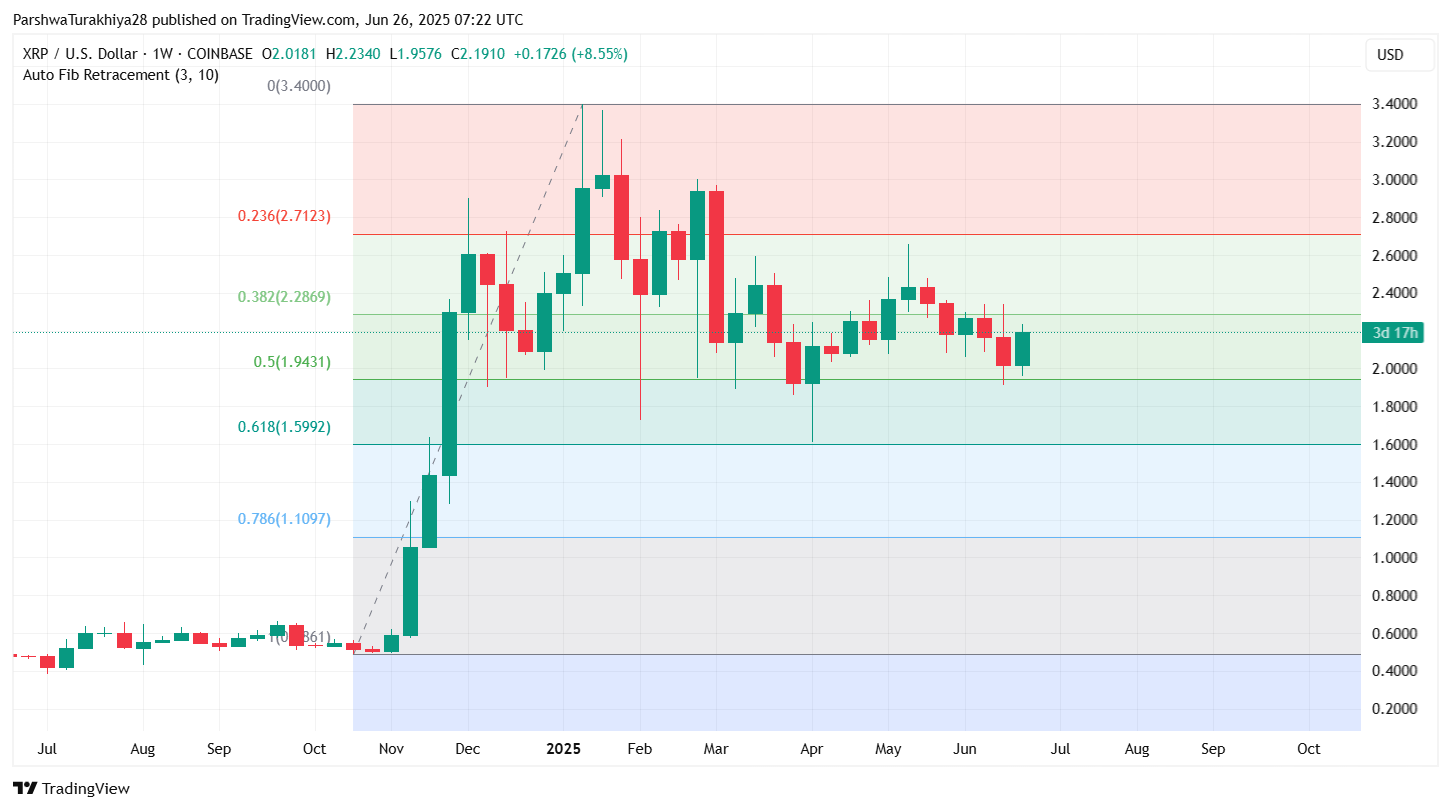
To paint a tug-of-war between bulls and bears, the weekly chart for the XRP has been moving between the $1.94 and $2.29 price range. For three weeks, XRP was dancing a precarious waltz around the middle of the channel until a surge in buying gave it some power to punch above $2.15. Although a modest one, the breakout may just be hinting at a possible comeback on the recent fall, giving some hope to XRP holders.
XRP price dynamics (Source: TradingView)
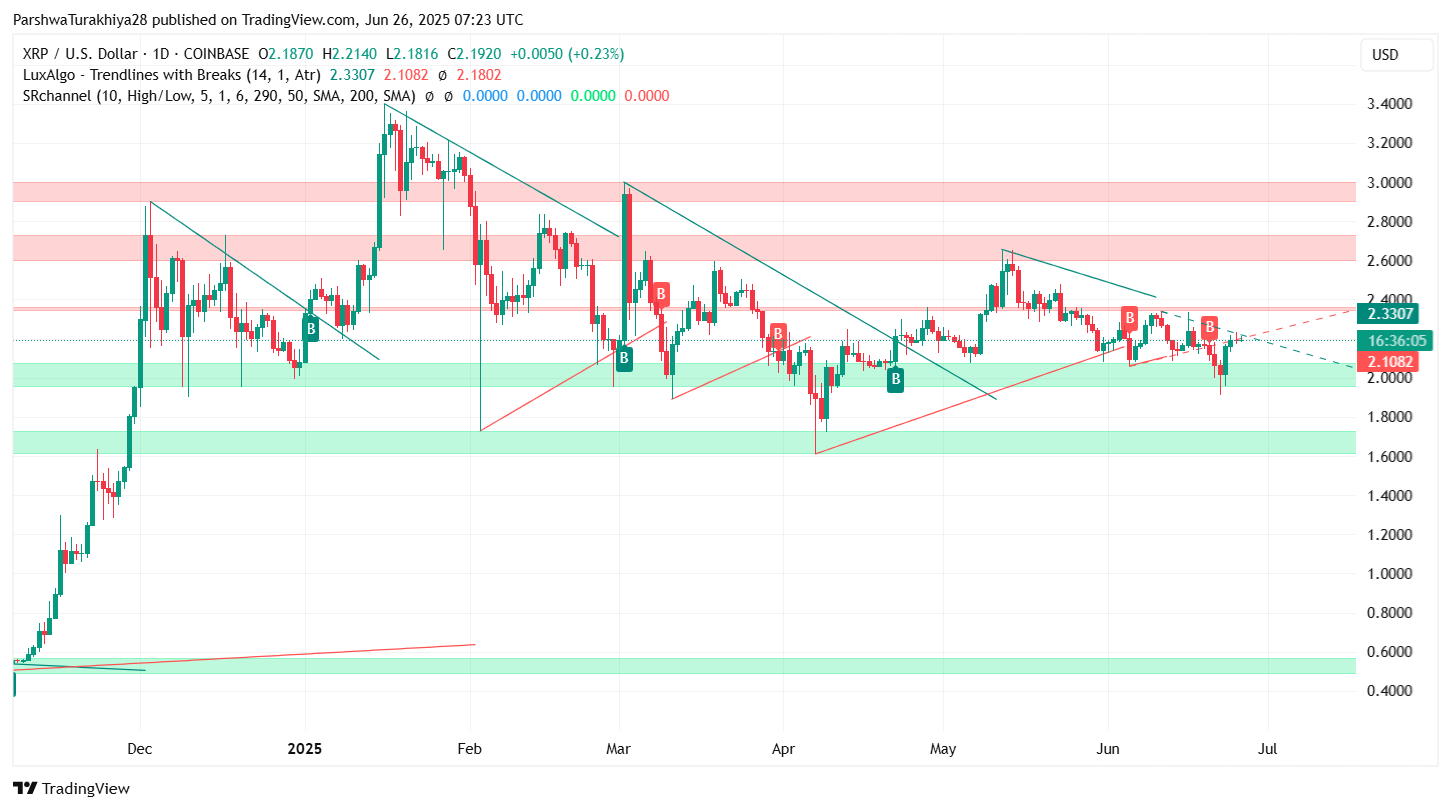
The price is coiling like a spring. Would a break out above $2.21 allow the pent-up bullish energy to be released into a run at $2.30 to $2.33? Watch for a decisive move; the current standoff between buyers and sellers just below the trendline spells an imminent breakout. Resistance at $2.33 and support at $2.10 are key levels within which this narrowing triangle is set.
Why XRP Price Going Up Today?
Prices of XRP shot up today after a rally was ignited upon bouncing strongly from the $2.00-$2.05 zone. Sharp traders taking note of the bullish signals ahead proceeded to engage themselves in mass buying. The 4-hour chart backs the change: it flipped the market structure-broken above $2.10-So the momentum was instantly introduced into the bullish camp.
XRP price dynamics (Source: TradingView)
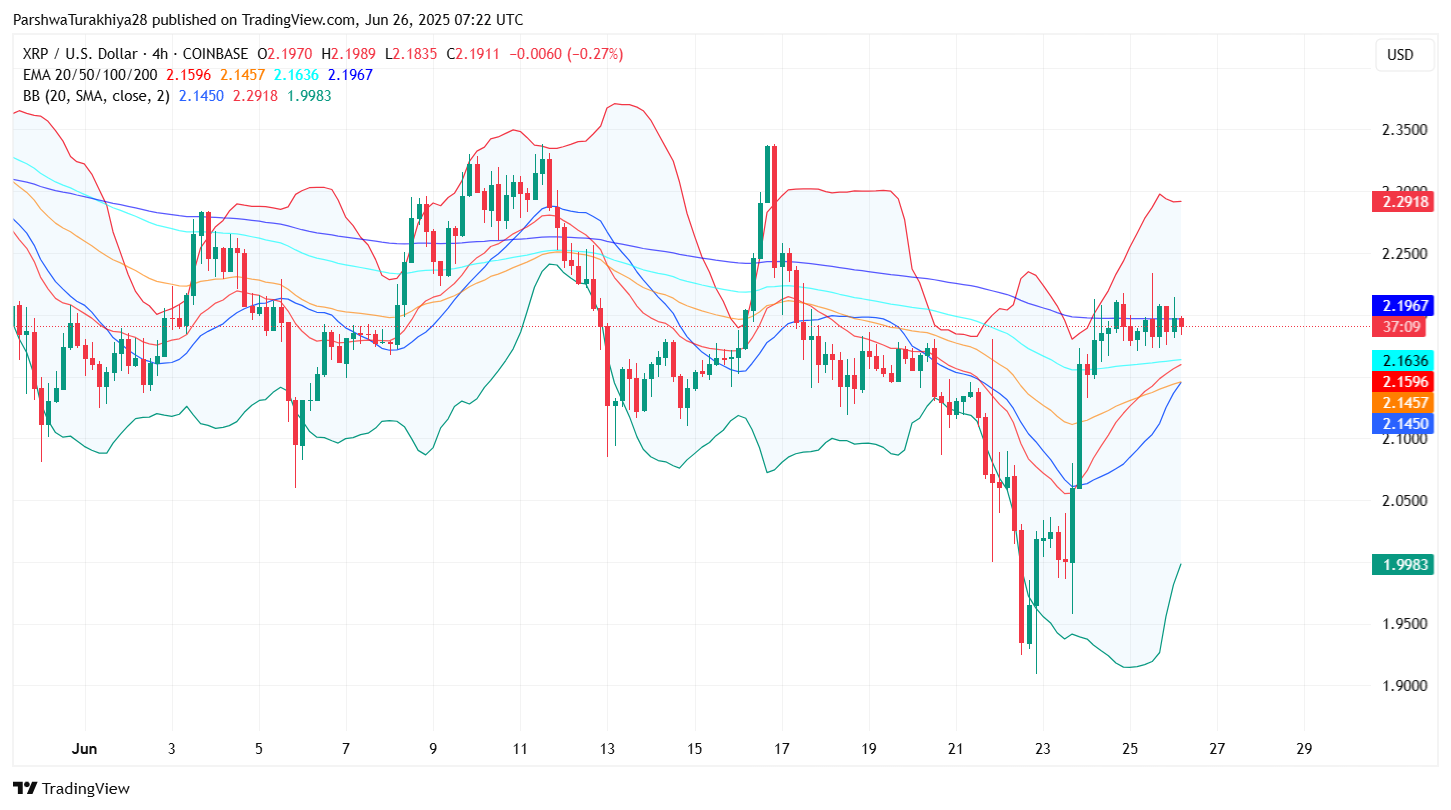
XRP is coiled like a spring, ready to leap. On the 4-hour chart, the Bollinger Bands are in the process of widening, having undergone a tight squeeze formation earlier, and this signals a near breakout. Supported by the 20, 50, and 100 EMAs, XRP is building bullish momentum just under the $2.21 resistance level, so expect volatility to rise as it attacks this key ceiling.
XRP price dynamics (Source: TradingView)
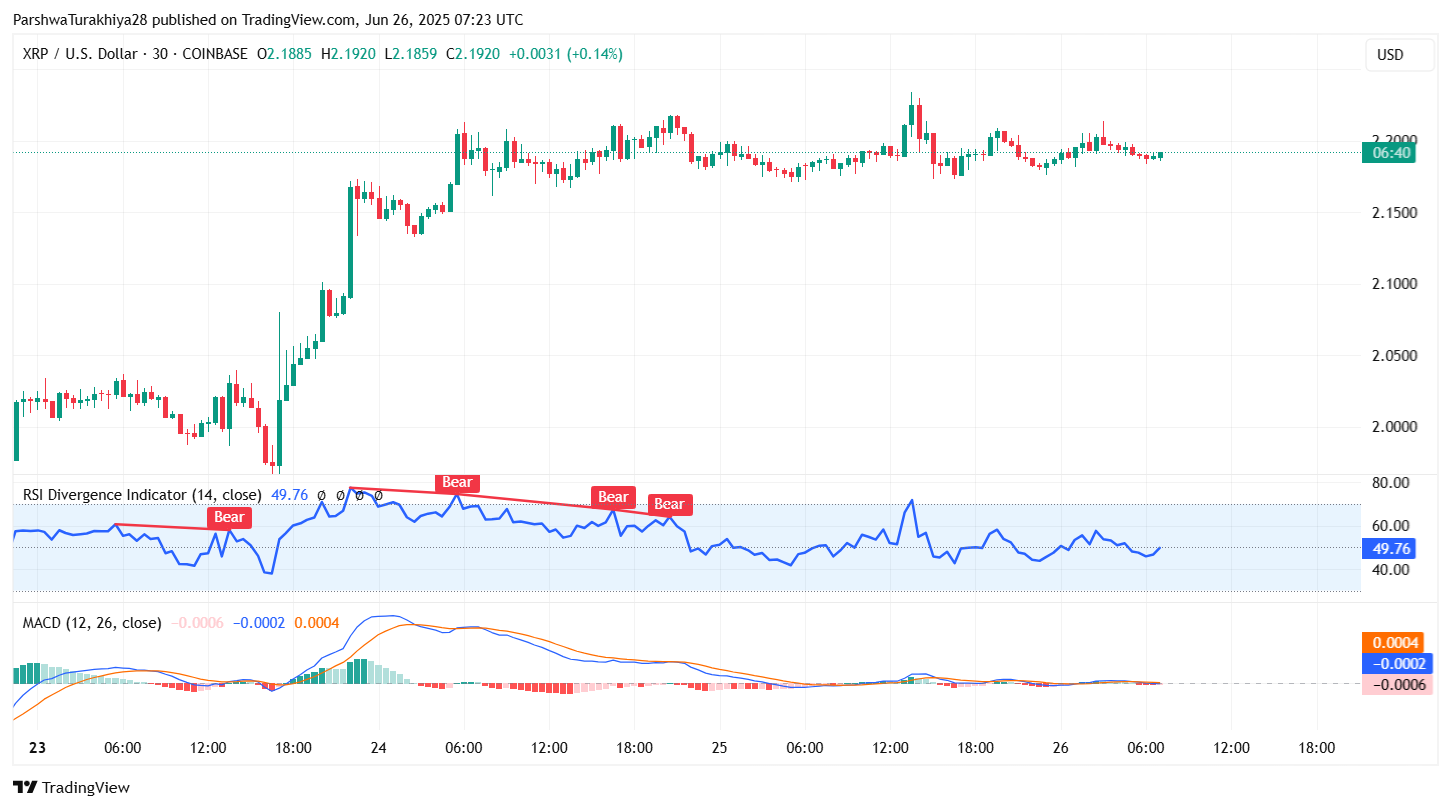
But HOLD ON! Rain clouds are ready to burst on the half-hour RSI. While the price flirts with new highs, the opposite story is being whispered by the RSI: bearishly diverging at 49.76, flashing multiple “Bear” warnings. The MACD? Flatlining. Its histogram is struggling near the zero line, sluggish to generate any momentum. This downside divergence drains the energy from any immediate move higher. Unless the volume appears in full force like a VOLCANO and they manage to break through $2.21, the upside is likely capped.
XRP Price Structure Shows Squeeze Between Key Liquidity Zones
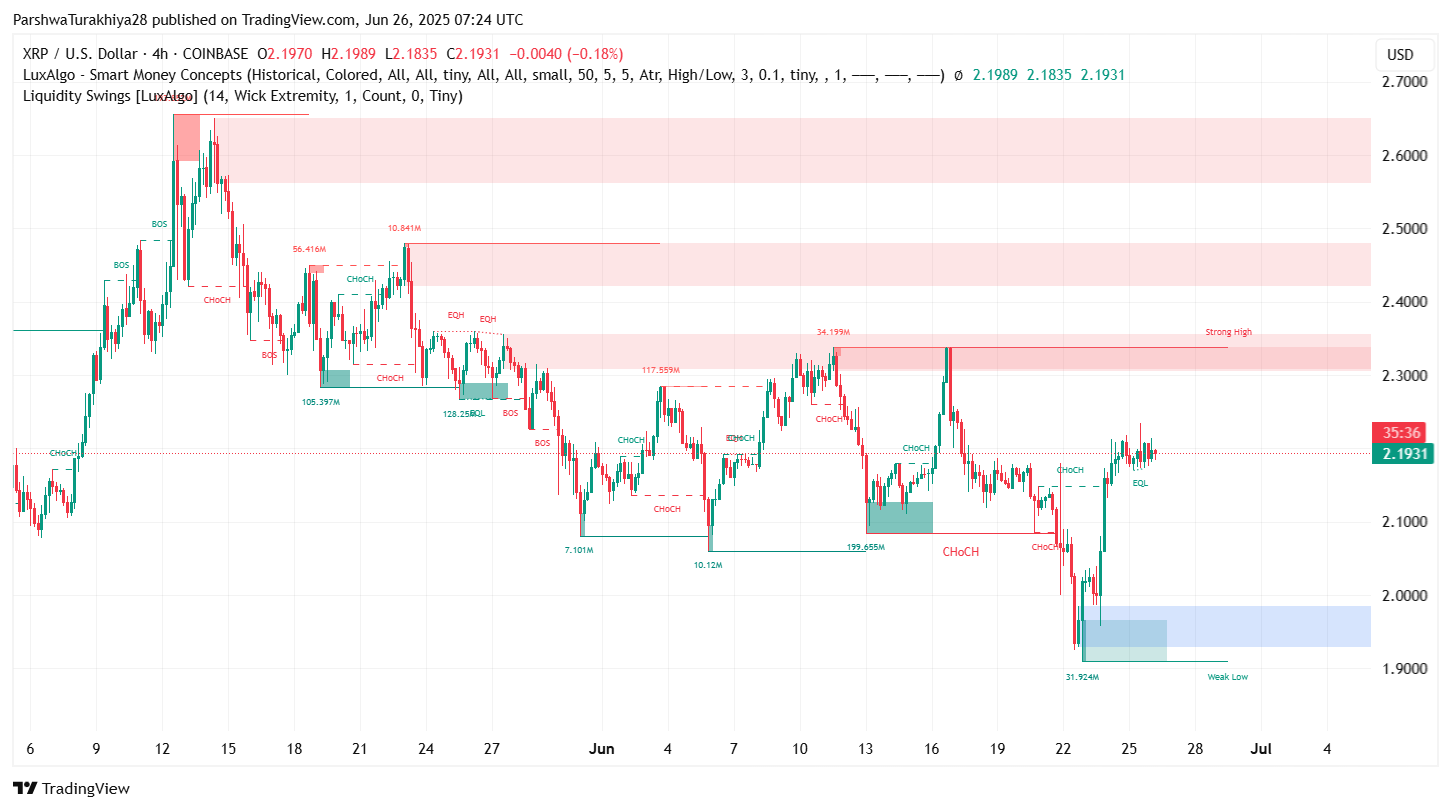
XRP price dynamics (Source: TradingView)
There is a tug of war playing out between bears and bulls, as a major “strong high” near $2.30 keeps a big top aboveprice, taunting buyers with a series of rejects (EQH). Would the breakout above this resistance lead to a giant jump having buyers consuming every bit of resting liquidity above? Or would this lower weak safe-zone of $1.90-$2.00 be tested yet again? The stage is set for a dramatic breakout or breakdown.
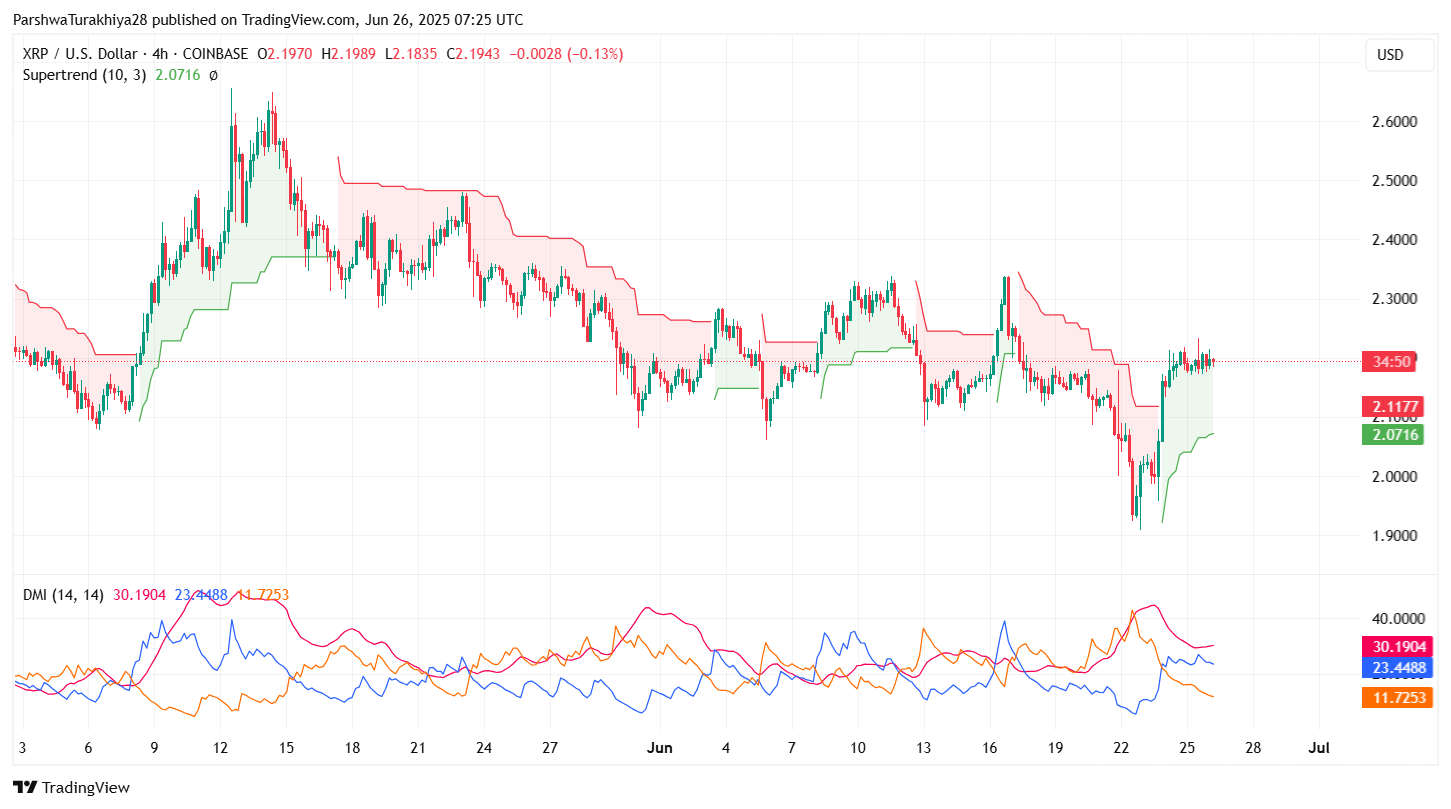
XRP price dynamics (Source: TradingView)
In our favored scenario, the Supertrend turned bullish on the 4-hour chart, perhaps representing a seed from which the price might grow upward from $2.07. The DMI thinks otherwise, however. It says that-with +DI and -DI lines side-by-side-the one-dimensional trend doesn’t exist and the ADX wimpers, signaling faint beats of a heartbeat. Let’s call this scenario a tied-up spring: price action is tightening now, with moving averages and volatility bands fighting against each other, waiting to erupt… in which way?
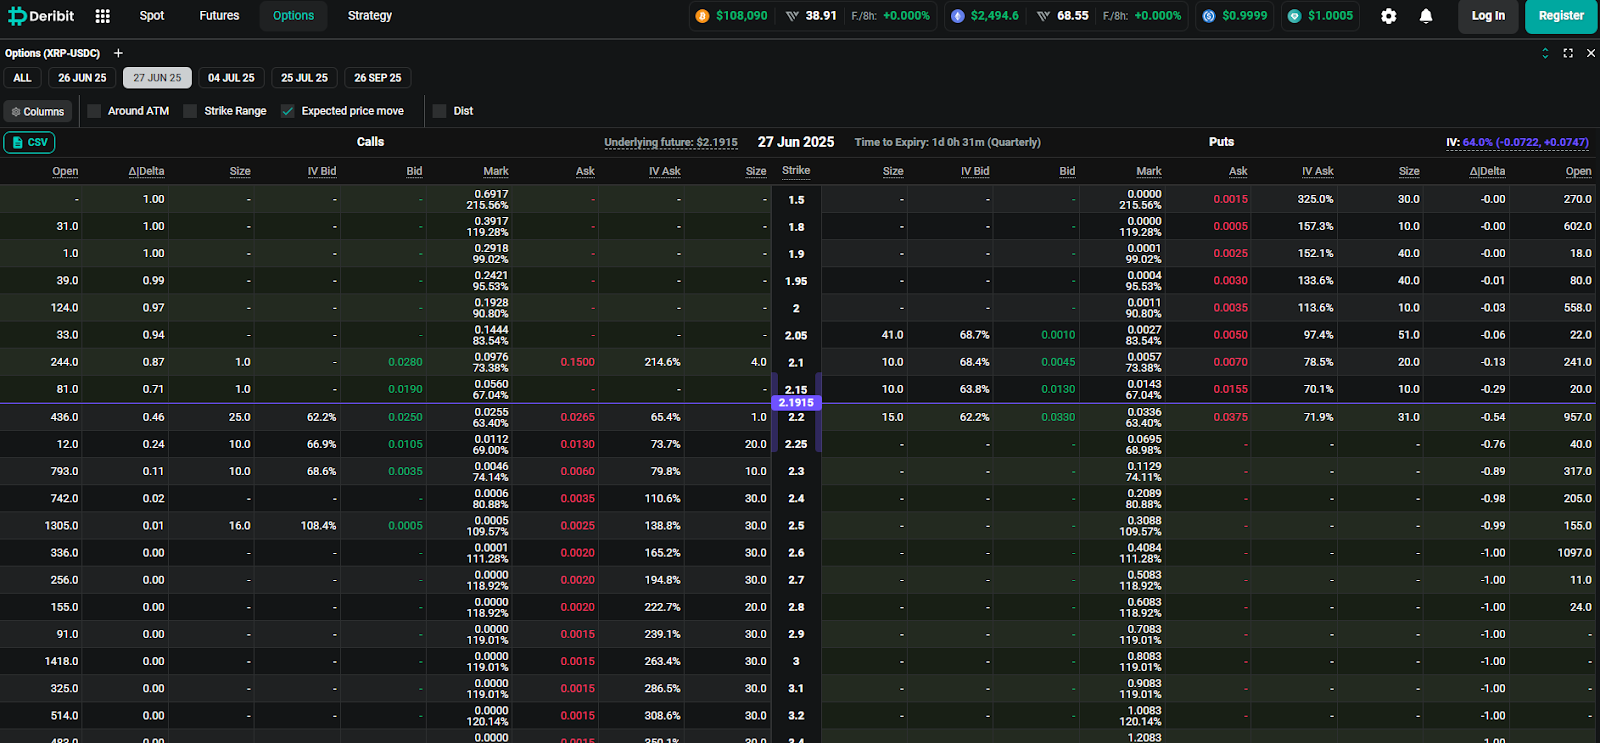
XRP option chain data (Source: Deribit)
Options data for 27 June paint an enticing view: a high-stakes showdown is in the works somewhere near the $2.20–$2.25 price. Heavy open interest in this price region seems to indicate that traders are keeping a finger on the decisive, make-or-break move to be executed upon contract expiry. Surge or plummet? The market is holding its breath.
XRP Price Prediction: Short-Term Outlook (24h)
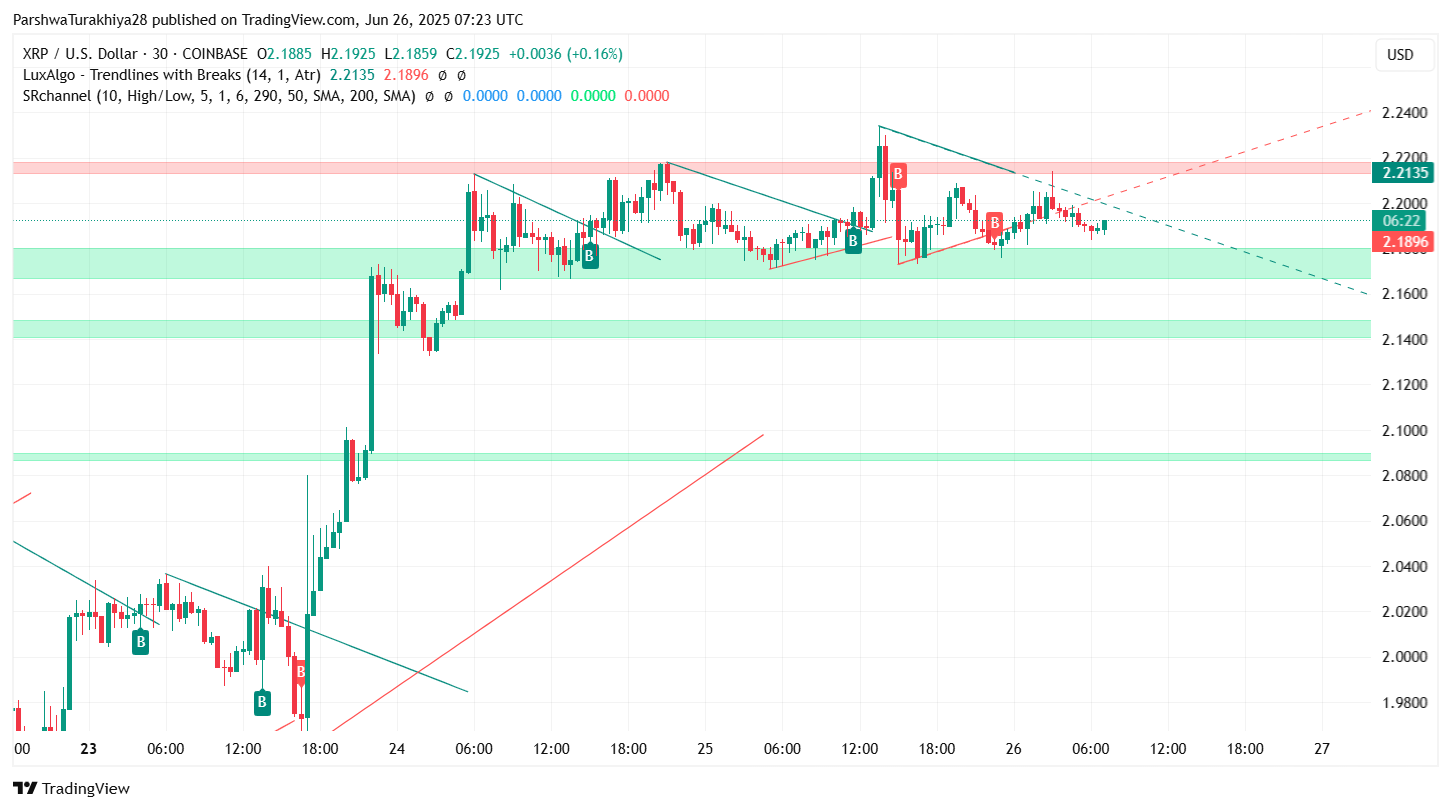
XRP price dynamics (Source: TradingView)
Buying these Xrps will be calculated less than $2.2135, against the resistance of a symmetrical wedge. Once the price has broken out of the top and hourly candles confirmed their position above $2.22, investors rush up at $2.28 and $2.33, where sellers have had their domination.
Conversely, if it falters and plunges below the support of $2.1450, which is reinforced by the convergence of EMAs on the 4-hour chart, prepare for a pullback. Going down the downside, bears can drag prices back to $2.08 and even attempt to test buyers at $1.9980. Be vigilant in keeping an eye on that blue demand zone on the liquidity chart-it could well turn into the next battleground.
The price of XRP is on a knife’s edge. The fight is for a move: can the bulls break and hold $2.21, or will the bears seize control of the $2.14-$2.15 zone and trigger a downtrend? A sluggish MACD accompanied by a lingering and well-promoted RSI divergence makes the path ahead for XRP downright unpredictable-but volatility is a given.
XRP Price Forecast Table: June 27, 2025
| Indicator/Zone | Level/Signal | Interpretation |
| Resistance 1 | $2.2135 | Intraday breakout zone |
| Resistance 2 | $2.3300 | Strong high liquidity & rejection zone |
| Support 1 | $2.1450 | EMA cluster zone |
| Support 2 | $2.0000 | Weekly demand & liquidity block |
| RSI (30-min) | 49.76 (Diverging) | Bearish divergence warning |
| MACD (30-min) | Flat near zero | Low momentum |
| Bollinger Bands (4H) | Expanding | Volatility increase likely |
| Supertrend (4H) | Bullish above $2.07 | Upside bias if support holds |
| SMC Liquidity Zones | $2.00–$2.05 (support), $2.30–$2.33 (resistance) | Compression between extremes |
| Options OI (27 June) | $2.20–$2.25 | Key magnet zone for expiry |
From the way the price looks, it is almost like it is battling a fierce resistance at $2.19. With bulls and bears refusing to adjourn, higher timeframe supports are binding the price down to safety. However, at $2.21, there is some sort of barrier that stands in the way of the breakout. If a breakout were to begin here, expect a strong upward move towards $2.30 and $2.33. Pay attention! There is a bearish RSI divergence warning sign flashing. There could be potential pullbacks and moments of volatility as the options expiry nears. Will XRP break away, or will the bears take control for themselves? The next few hours will tell the tale.
Heads up: This article offers insights for informational and educational purposes. Think of it as just a learning tool-not financial advice. Coin Edition is not responsible for any financial setbacks that you may undergo as a consequence of appearing in this article. Please navigate accordingly and do your independent research prior to making any decision.
Thanks for reading XRP Price Prediction For June 27

