XRP: Still Eyeing $5 Despite the Turbulence?
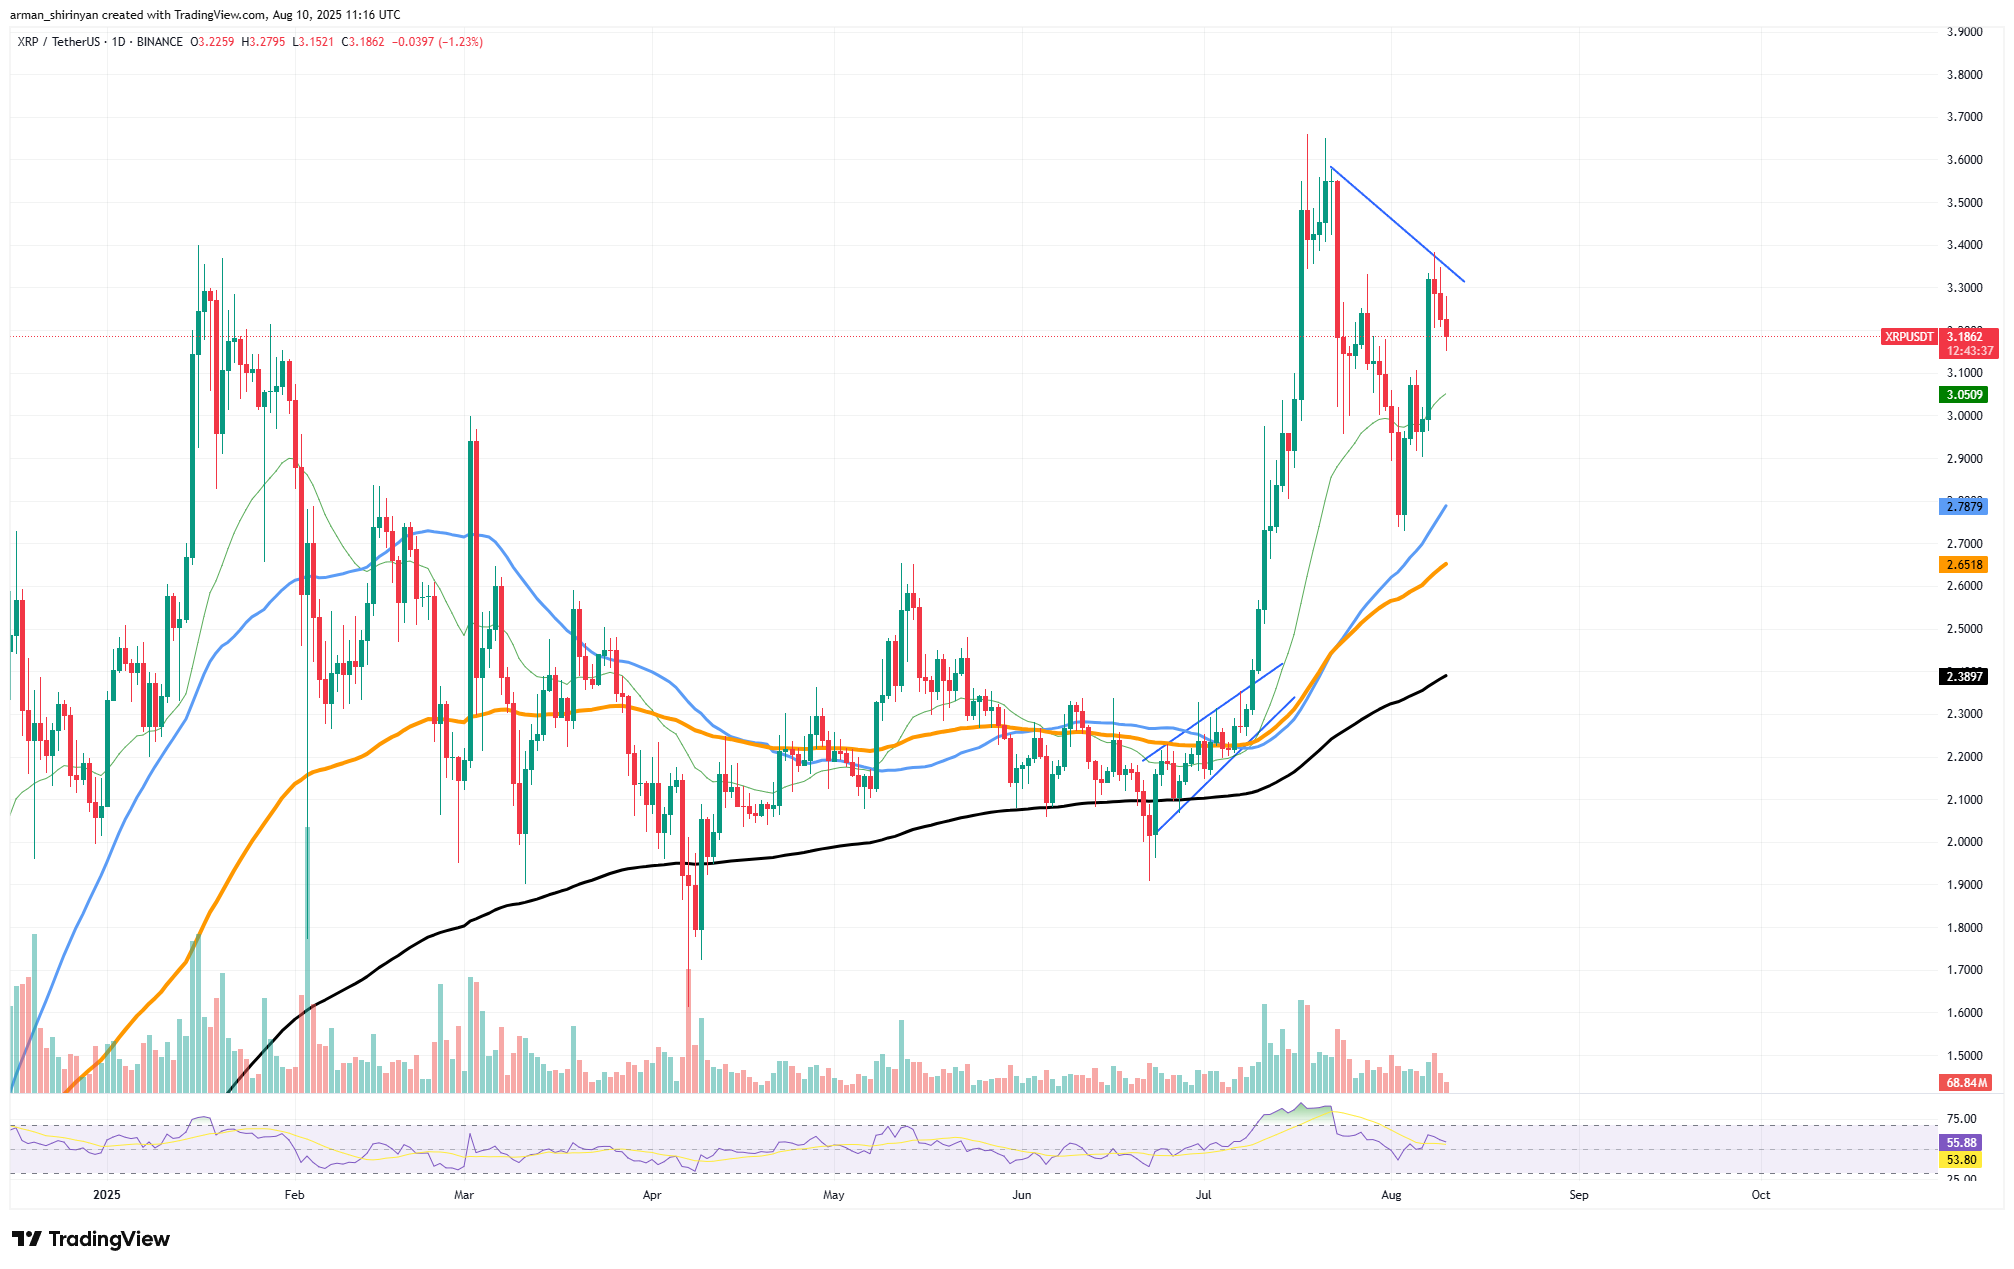
July’s explosive surge, catapulting XRP from $2.40 to nearly $3.60, may feel like a distant memory amidst recent market jitters. Currently hovering around $3.20, XRP is catching its breath. But don’t mistake consolidation for capitulation. The critical point? XRP is stubbornly clinging above key moving averages. This suggests the underlying bullish narrative remains very much alive. The $5 target? Still within reach.
XRP is locked in a tug-of-war, its price advances currently barricaded by a stubborn descending trendline tracing back to late July. Think of it as a ceiling hovering around $3.35-$3.40. But the bulls are gathering strength, ready to charge. Their immediate target? $3.60 – the last major hurdle standing between XRP and a run towards $4.00, and ultimately, the coveted $5.00 mark. Smash through that ceiling, and it’s game on for a significant surge.

$5 XRP isn’t a pipe dream, it’s a delayed rocket. Recent price jolts prove that once the engines ignite, XRP can blast off with surprising speed.
XRP: Primed for liftoff? A wave of positive vibes washes over the crypto market, fueled by wider adoption in payment systems and strengthened core principles – all potential launchpads for a significant surge. Keep a close eye on the 50-day EMA ($2.79) and 20-day EMA ($3.05); these are crucial support levels. Savvy, long-term investors might see dips to these points as golden buying opportunities, provided these levels hold firm, safeguarding XRP’s bullish trajectory. Think of it as building a strong foundation before the rocket blasts off.
Forget the FUD! The $5 XRP dream isn’t dead, just hibernating. Sure, the charts are throwing shade with short-term dips and that pesky trendline, but the future’s still bright. To ignite the rocket, XRP needs to conquer the $3.60 fortress. Once that’s claimed, look out $4.00! Bust through that mental barrier, and $5? That becomes a very real, very tangible destination. Believe.
Shiba Inu develops
Shiba Inu: Is a Bearish Head and Shoulders Formation Brewing?
Shiba Inu is at a critical juncture. After repeated failed attempts to pierce through resistance stemming back to late July, a concerning head and shoulders pattern is taking shape on the daily chart. Currently hovering around $0.00001338, SHIB appears to be succumbing to intensifying downward pressure. Is this a temporary dip, or the prelude to a more significant correction?
After carving out a potential left shoulder in early July, the price surged, aiming for the mid-July high of $0.00001550. Now, the bulls face a double whammy: the stubborn 200-day EMA (~$0.00001428) and a persistent descending trendline. Despite a recent bounce from the $0.00001200 level, hinting at a possible right shoulder formation, the price struggles to break free from this resistance web.
Shiba Inu teeters on a knife’s edge! A potential neckline forming between $0.00001200 and $0.00001220 could trigger a sharp descent. Watch for the critical support zone around $0.00001000, with the first line of defense at $0.00001150. A decisive daily close below this could unleash the bears.
However, the battle is far from over! Bulls can still seize control by smashing through the 200-day EMA and conquering the $0.00001450 resistance. This is where SHIB either breaks down or breaks out!
Can this micro-cap break free? After a sluggish summer, whispers suggest a potential surge towards $0.00001550, with the boldest bulls eyeing a retest of the elusive $0.00002000 resistance. While volume remains a fraction of its July frenzy, the Relative Strength Index hovers near 53 – a tantalizing hint of building momentum in a market holding its breath. Is this the calm before a speculative storm?
Shiba Inu teeters on a knife’s edge. Traders are holding their breath, poised to either pounce on a breakout or brace for a breakdown. The market’s verdict on this pup? Still pending.
Bitcoin’s attempt
Bitcoin’s rally slams into a $120,000 wall, turning what bulls hoped would be a launchpad into an imposing fortress. After weeks of relentless assaults, the $118,130 line remains unconquered, each surge met with a wave of selling, leaving the market adrift in choppy, uncertain seas. Will Bitcoin break free, or will this barrier prove insurmountable?
Bitcoin’s rally, ignited in May from a $95,000 springboard, faces a formidable $120,000 ceiling. This isn’t just a number; it’s a battlefield where bulls have repeatedly tasted defeat. Will Bitcoin shatter this psychological barrier and historical resistance, or will the uptrend succumb? The immediate line of defense: the 20-day EMA at $115,964. Should that falter, the 50-day EMA at $113,934 – echoing a summer consolidation – stands ready. The fate of Bitcoin’s upward trajectory hangs in the balance.
If Bitcoin breaches these critical support thresholds, brace for a potential descent towards the 100-day EMA around $108,377, possibly triggering a deeper market correction. Recent resistance challenges have been met with tepid trading volumes, suggesting buyer hesitancy at these elevated price points. The Relative Strength Index (RSI), hovering at a neutral 57, reflects balanced market momentum, signaling neither overwhelming bullish nor bearish sentiment currently prevails.
Bitcoin’s rally faces a critical juncture. Failure to decisively shatter and sustain above $120,000 risks trapping it in a sideways grind or, worse, sending it spiraling into a deeper correction. Such a setback would not only delay the triumphant return to record highs but also cast a pall of gloom over the immediate crypto landscape.
Thanks for reading XRPs $5 Dream Not Over Yet Shiba Inu (SHIB): Head and Shoulders Forms Bitcoin (BTC) Price in Deep Waters

