Related Articles

HBAR’s meteoric rise appears to be losing altitude. After soaring an impressive 58.77% this month, the cryptocurrency has crashlanded, wiping out all weekly gains and plummeting over 8% in the last 24 hours. Is this a temporary turbulence or the beginning of a prolonged descent?
This isn’t your garden-variety dip. Beneath the surface of this pullback, whispers of historical precedent, urgent short-term chart warnings, and teetering support levels hint at a potential avalanche.
Historical Drawdowns Hint at a Familiar Profit-Taking Zone
Hedera’s Hit a Danger Zone – Prepare for a Potential Plunge?
HBAR bulls, take note! History might be about to repeat itself. Hedera’s current price action is flashing warning signs reminiscent of March 2025. Back then, HBAR soared to $0.26, still a hefty 53.74% below its all-time high. What followed? A brutal 47% crash that erased gains and sent the token spiraling to $0.14 in a single, agonizing month. Is Hedera poised for another profit-taking plunge? Keep a close watch.
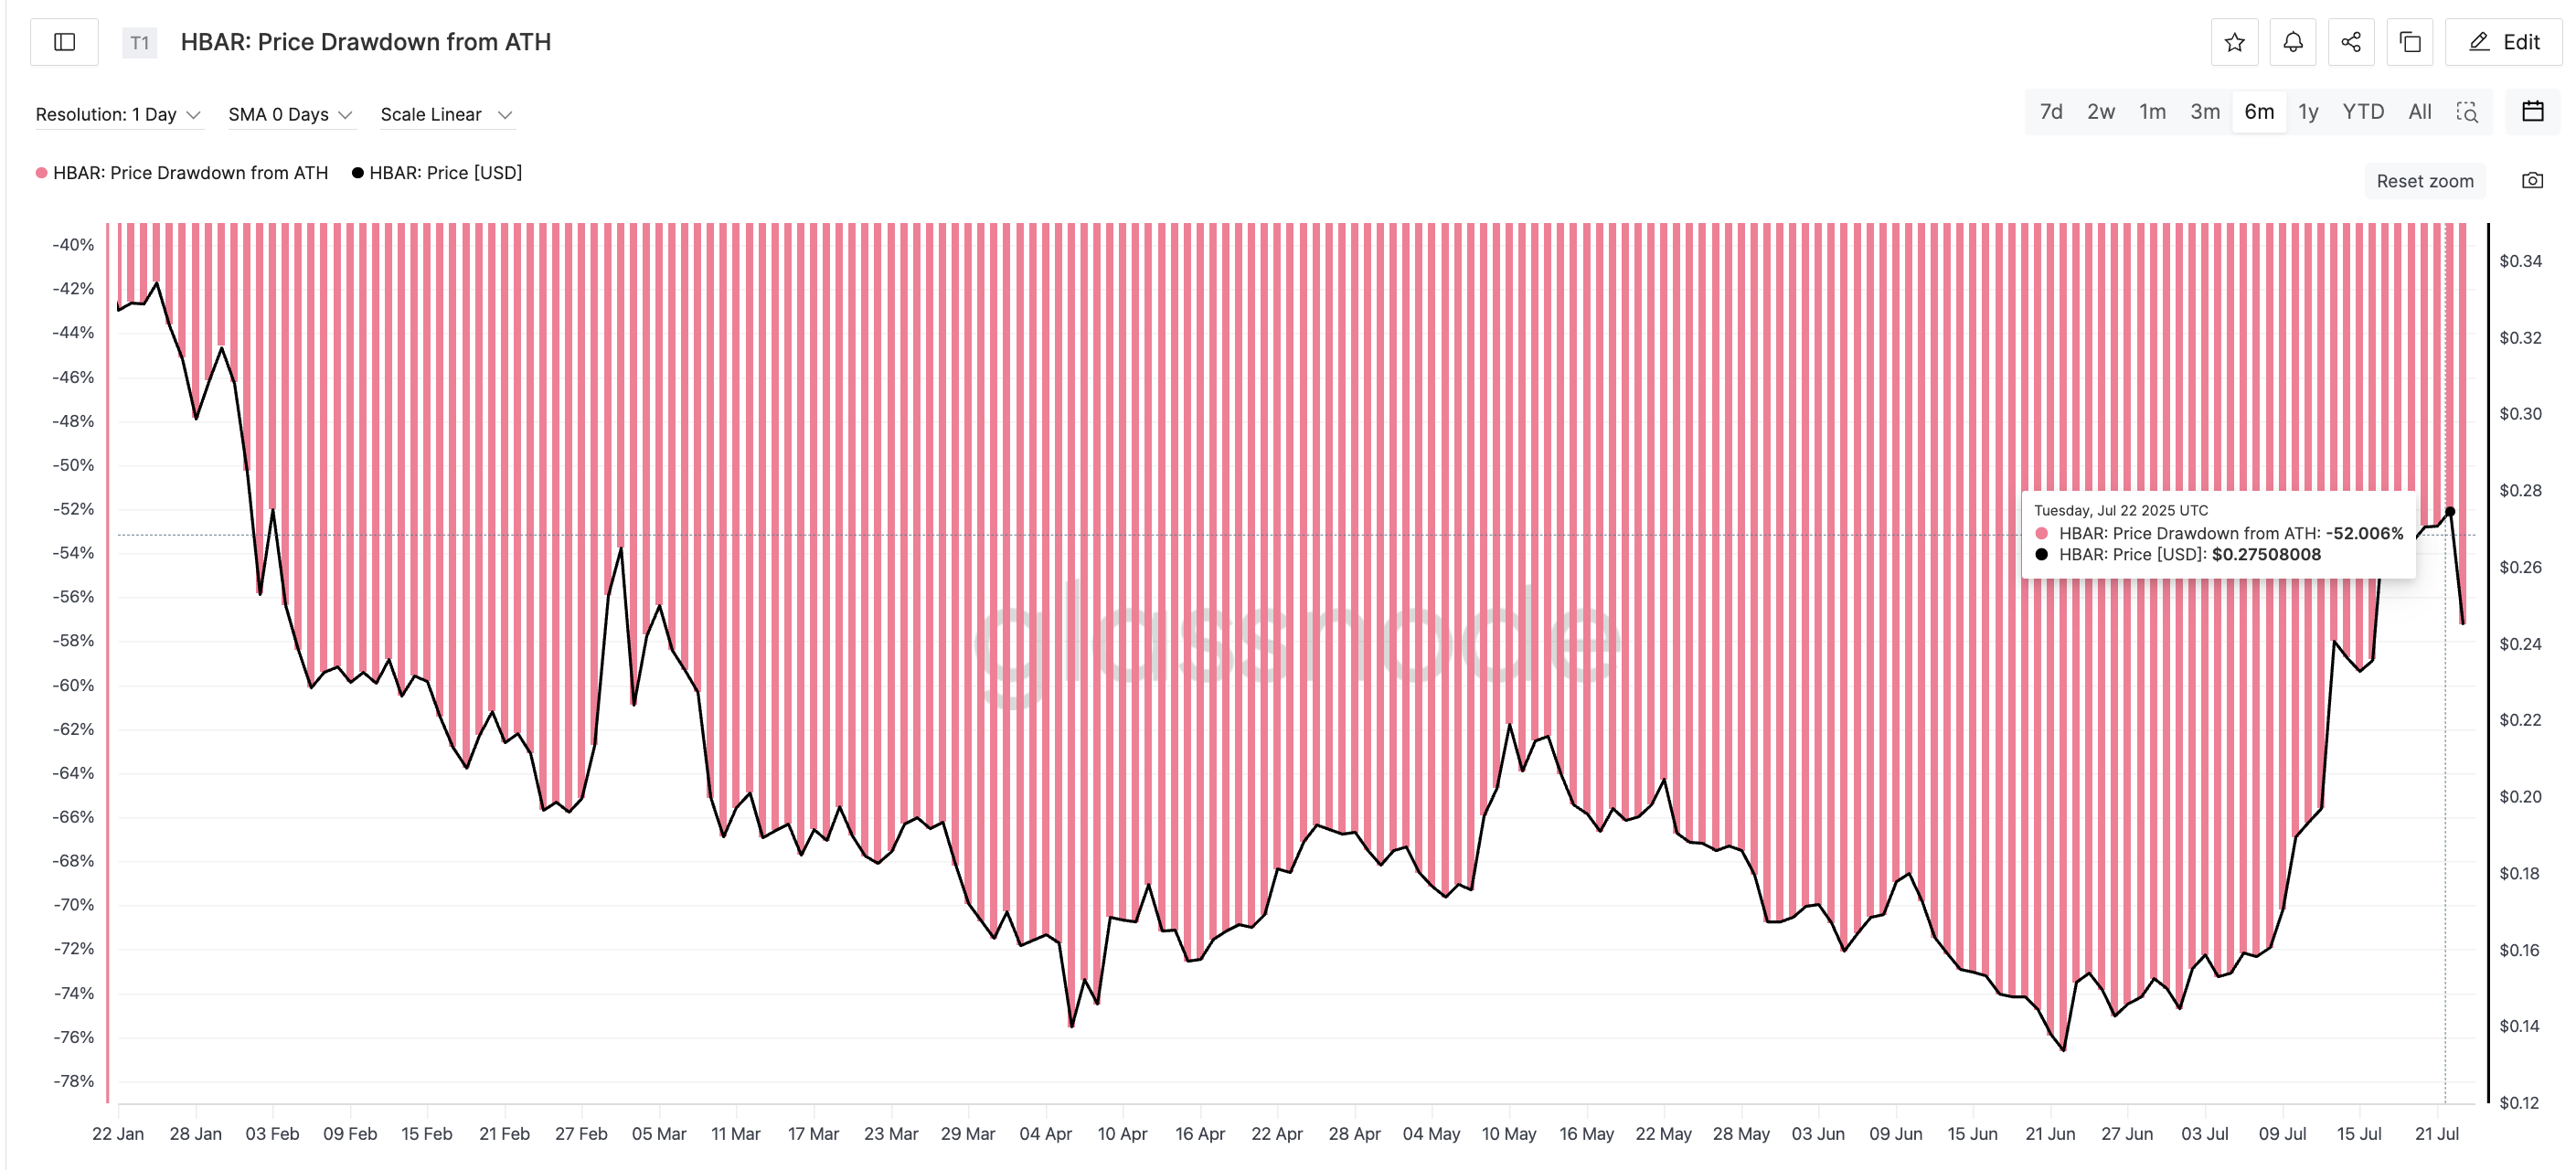
HBAR price ATH drawdown, and correction history: Glassnode
By July 22nd, HBAR had plummeted, investors reeling from a stomach-churning 52% drawdown as the price hovered around $0.27. But hold on – the tide may be turning. A correction is underway, hinting that seasoned traders are swooping in, sensing an opportunity to capitalize on this familiar 50-60% dip. Is this the calm before the next surge, or just a fleeting moment of respite?
“If HBAR mirrors March’s market moves, but with altcoins softening the blow, brace for a potential 40% dip from $0.27. That would land us near $0.16 – a price point that just so happens to coincide with a critical support level we’ll dissect further on!”
In short, historical drawdown zones are where traders have typically hit the brakes. And that pattern looks to be repeating.
Ever wonder how much your favorite crypto has dipped from its glory days? That’s the ATH Drawdown, revealing the distance between a token’s peak and its present price. It’s like a treasure map, highlighting zones where savvy traders often cash in their chips.
Death Cross on the 4-Hour Chart May Accelerate the HBAR Price Drop
The 4-hour chart whispers a chilling tale. The red 20-period EMA, a hungry predator, is stalking the orange 50-period EMA. This isn’t just any meetup; it’s a date with the “Death Cross.” Not yet triggered, but the trap is nearly sprung. Prepare for a potential market massacre.
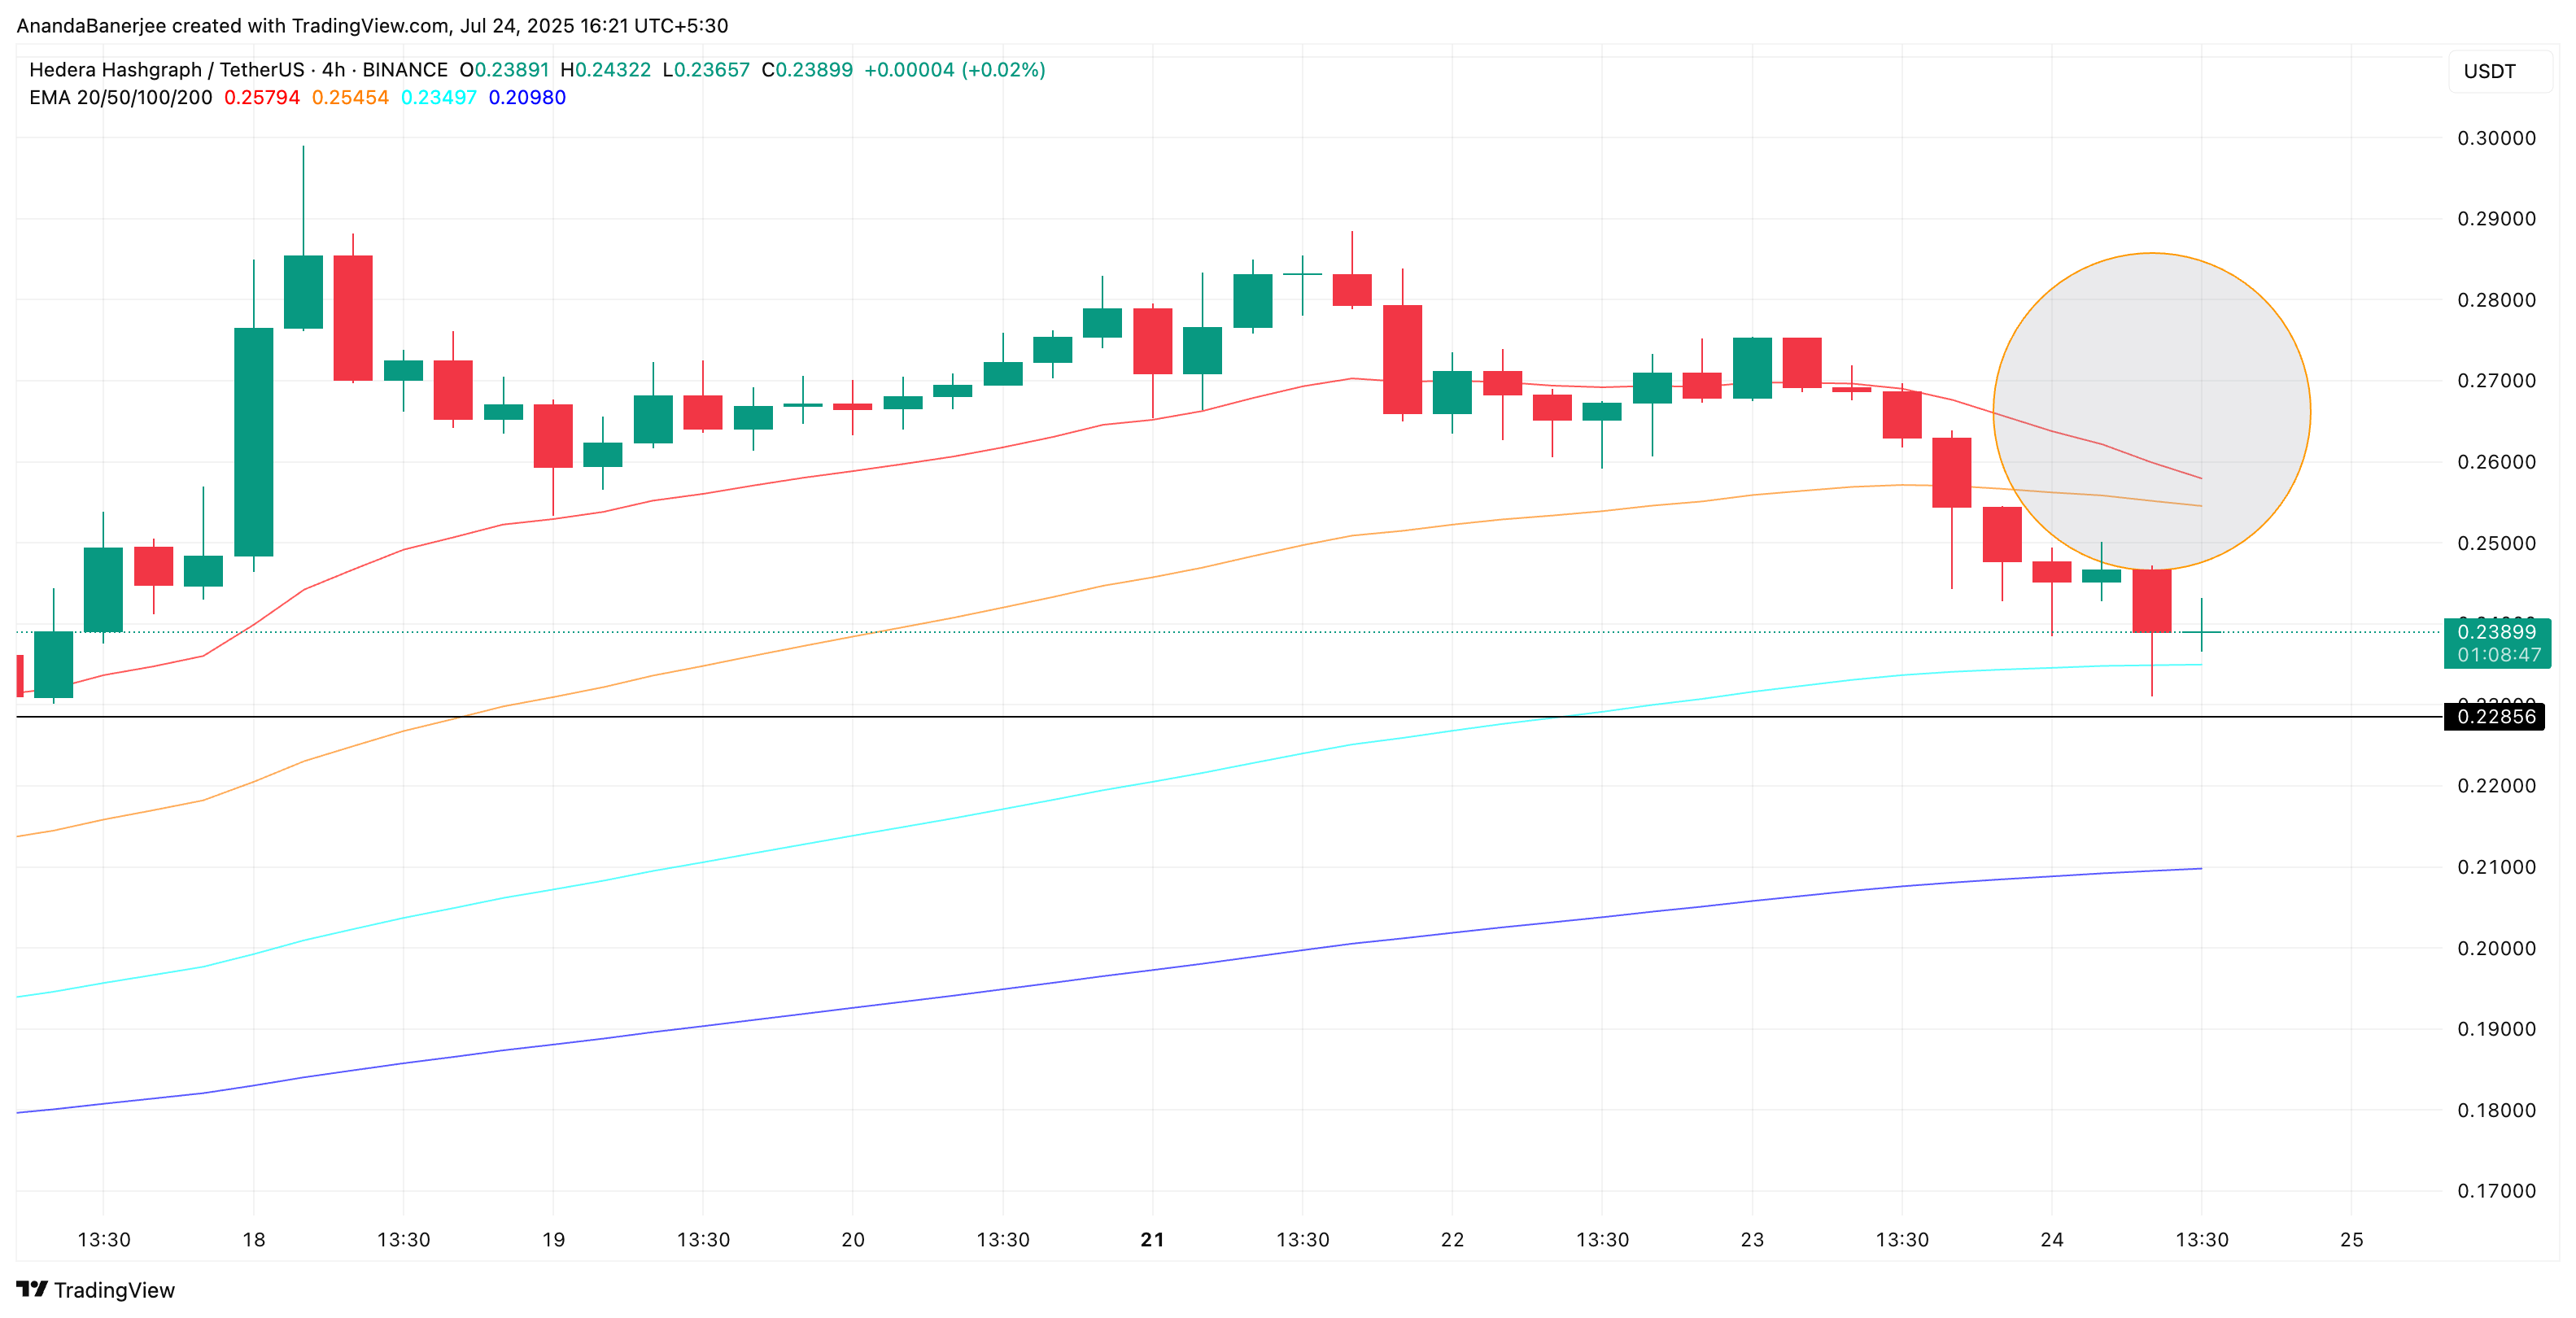
HBAR price and EMA crossover: TradingView
“The 4-hour chart? It’s our early warning system. Forget waiting for the daily – this timeframe sniffs out trend reversals faster, flashing a ‘bearish momentum ahead’ alert.”
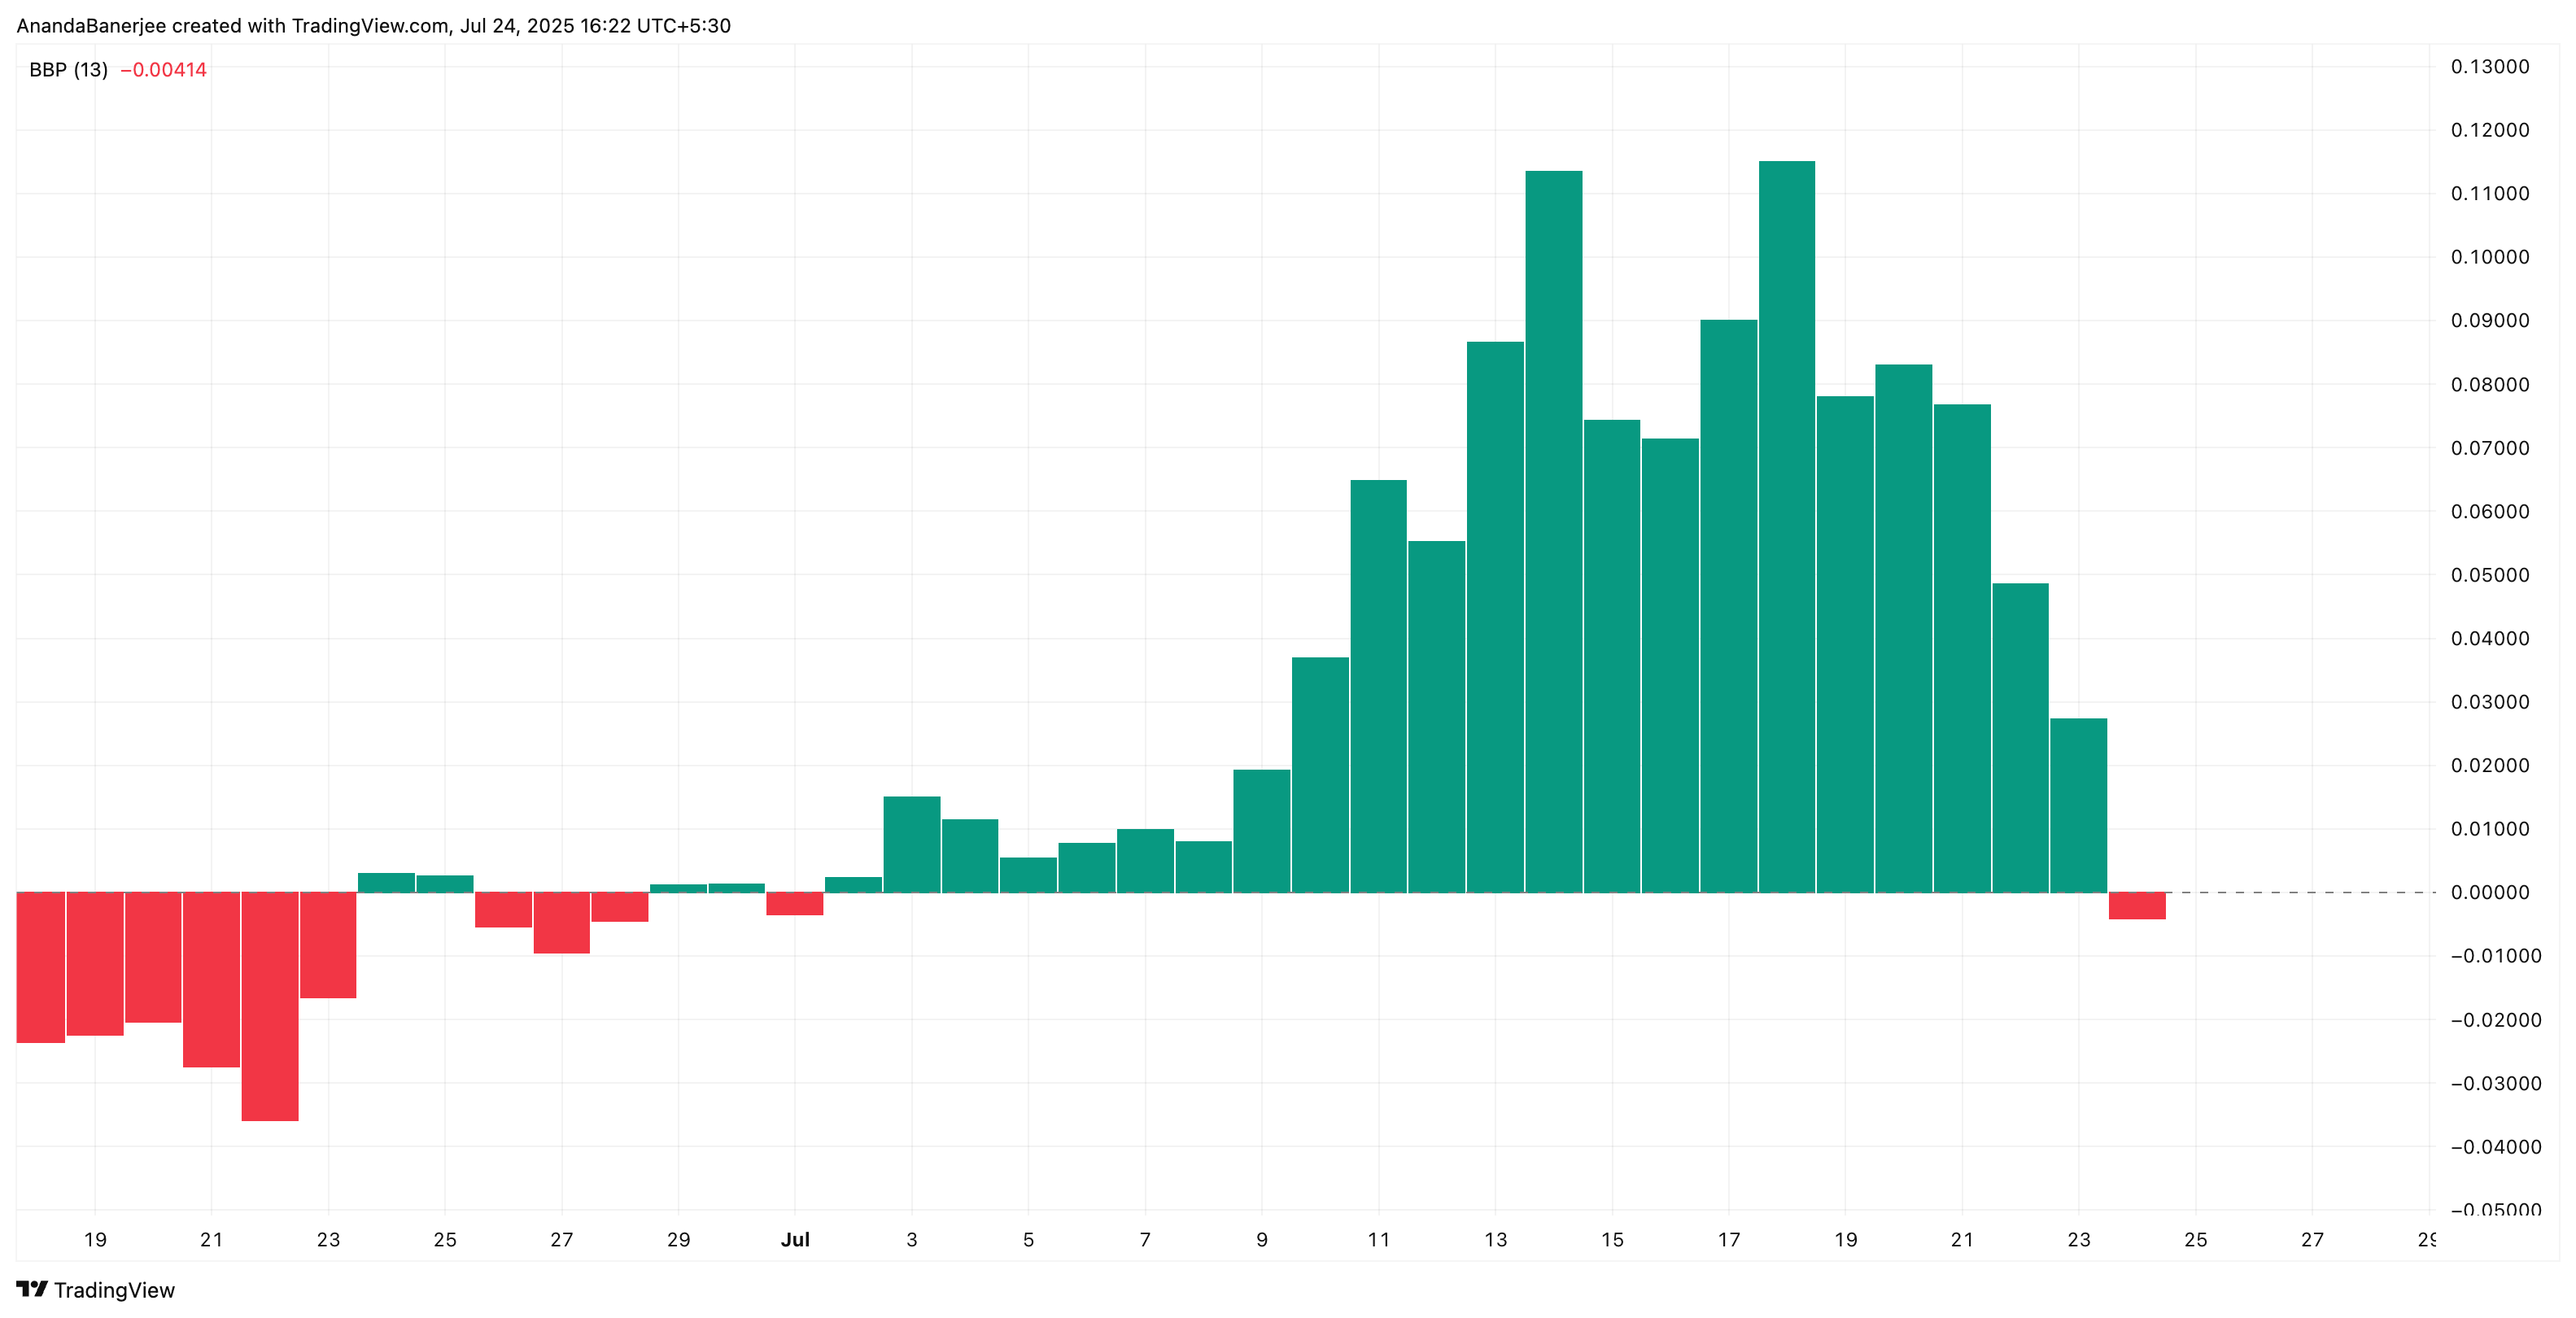
HBAR Bull Bear power indicator: TradingView
The Bull Bear Power Index just flashed a warning: red alert! Sellers are clawing their way to dominance, suggesting a potential freefall if buyers don’t rally. A confirmed bearish crossover could unleash a wave of momentum selling, turning the tide decisively – and history hints at a painful plunge.
Bull Bear Power: are buyers or sellers calling the shots? This indicator reveals the market’s tug-of-war. Watch for the shift to red. That’s your cue – the bears have seized control, and prices might be headed south!
Critical HBAR Price Support Lies At $0.21
HBAR’s price is locked in a tense standoff around $0.23, clinging precariously to the 0.382 Fibonacci retracement level. Imagine a tug-of-war: on one side, the bulls trying to maintain their grip; on the other, the bears eager to pull HBAR back down. This crucial level, drawn from a recent low of $0.12 to a high of $0.29, is the battleground. Will HBAR hold, or will it succumb to gravity?
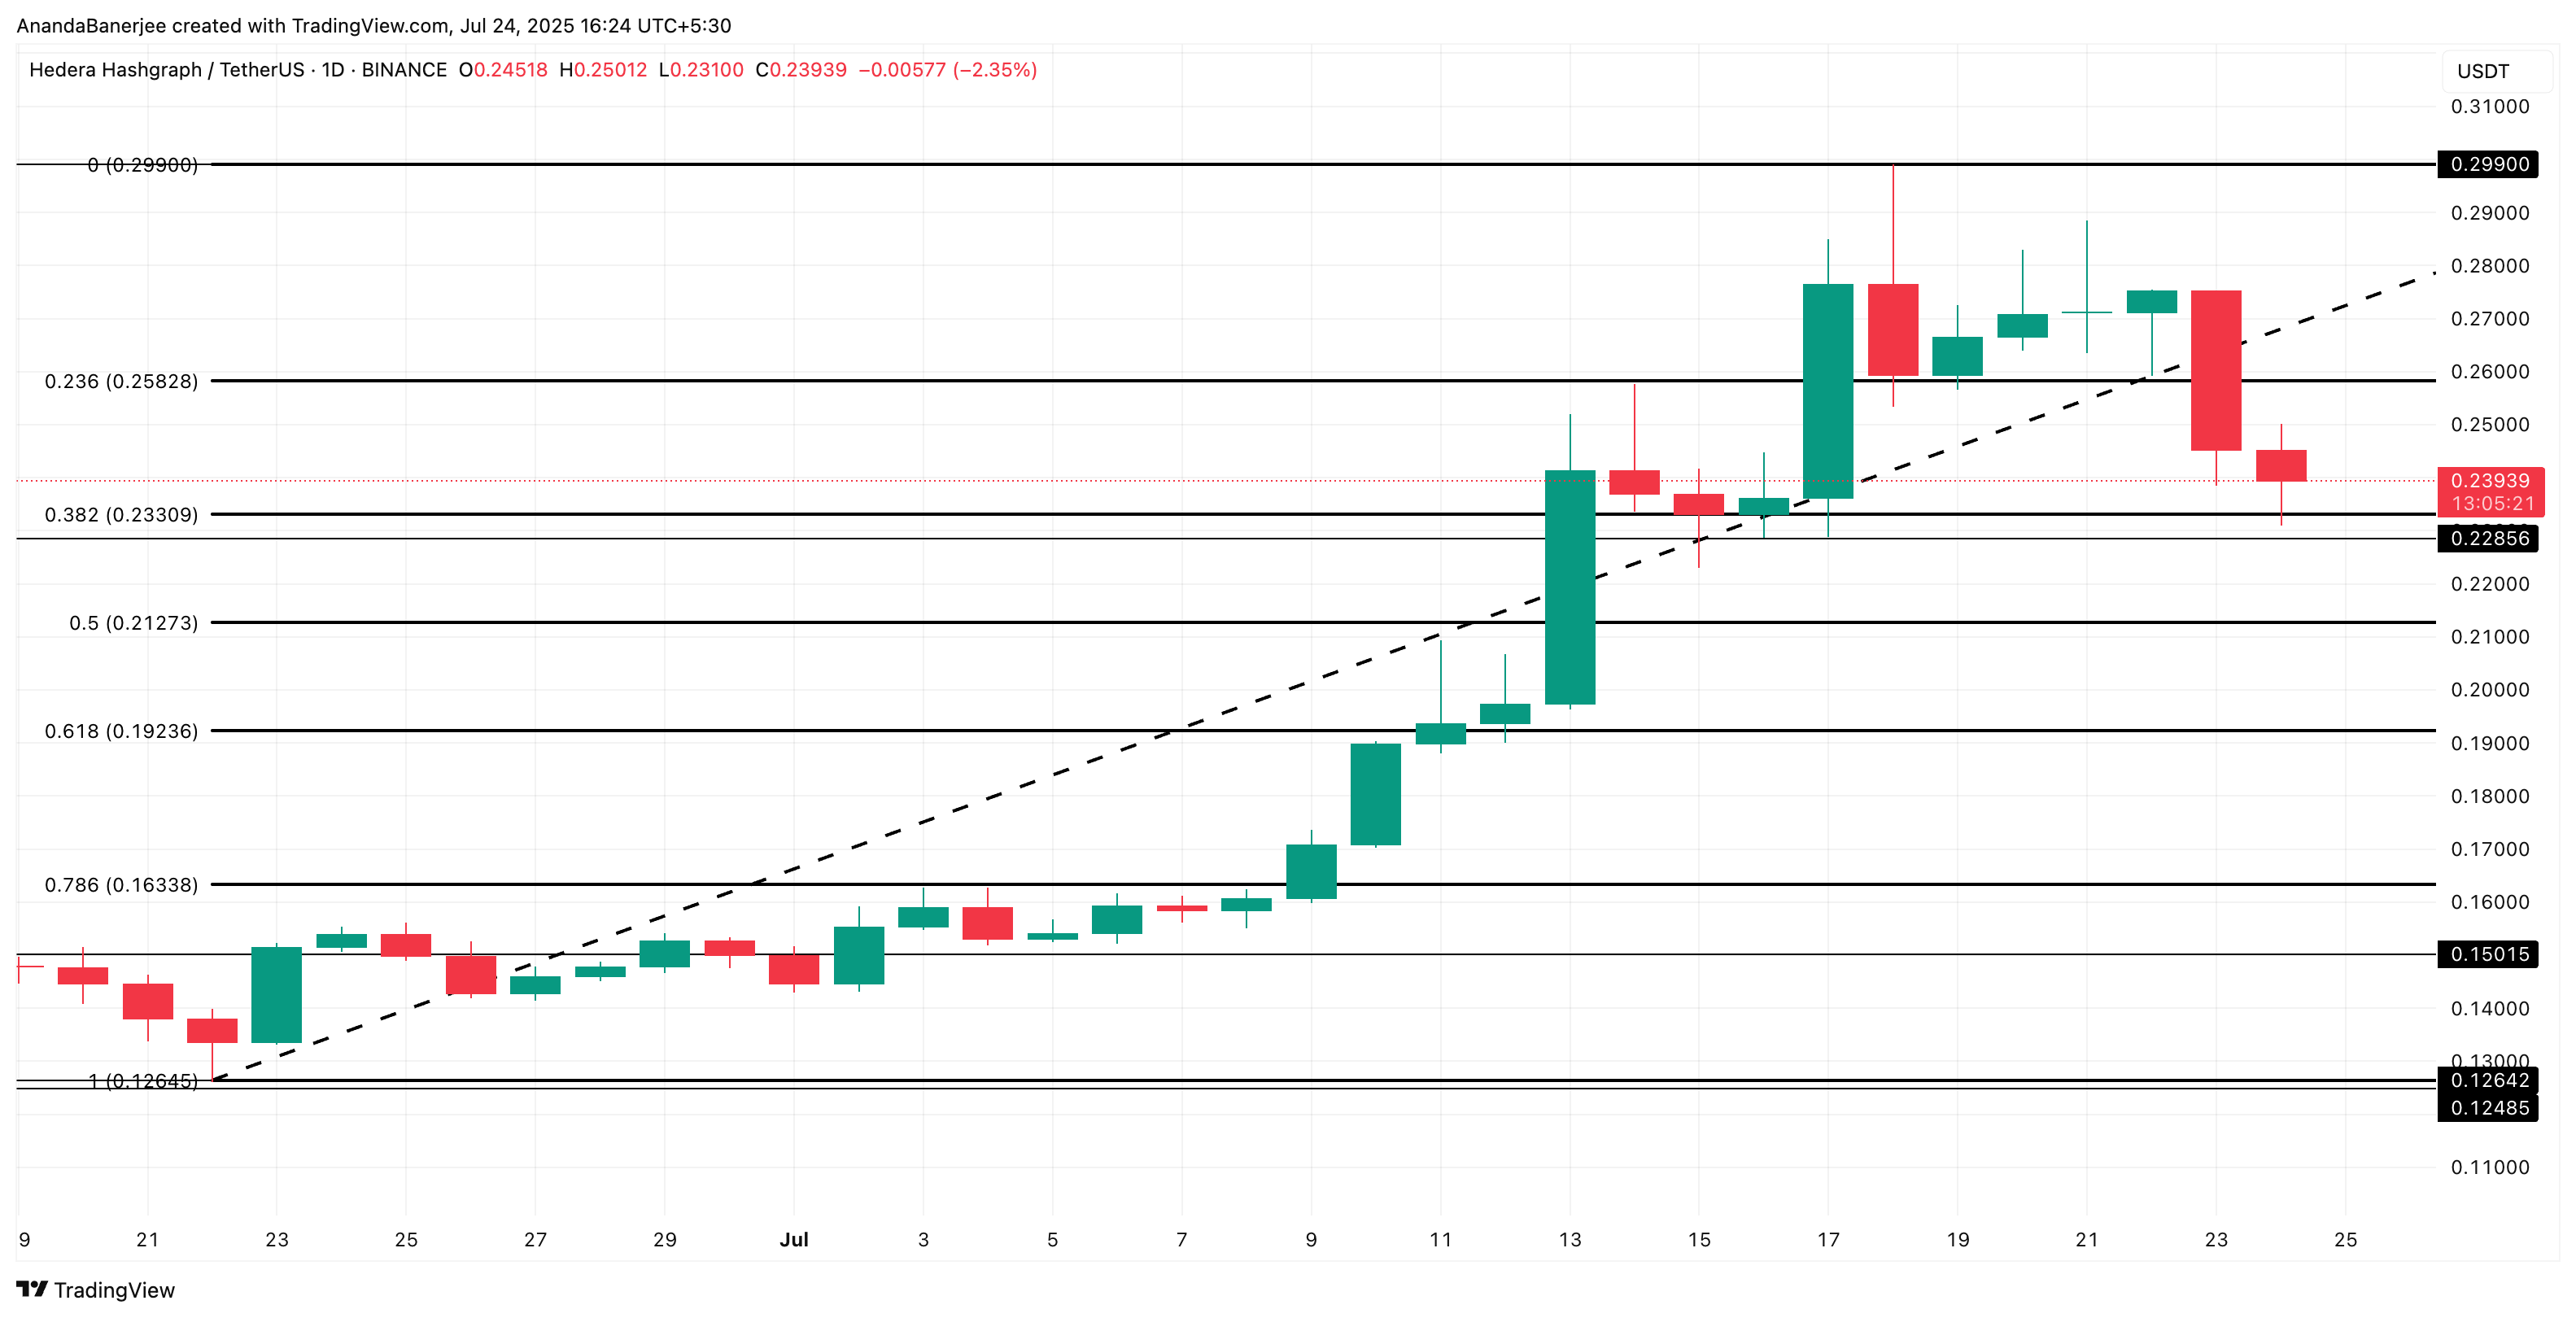
HBAR price analysis: TradingView
“Brace for impact: If the $0.23 line cracks – and the charts are whispering it will – look out below. The first parachute? A flimsy $0.212 (Fib 0.5). But if that fails, we’re staring down a slippery slope to $0.19, with the ultimate cliff edge at $0.16 – a gut-wrenching 40% plunge from recent highs.”
“But hold on if HBAR can muscle its way back above $0.25, turning that resistance back into solid support, and that dreaded death crossdoesn’tmaterialize? Then the bears might just have to pack their bags and go home.”
Thanks for reading Another 40% Crash for Hedera? History Says It’s Possible

