Bitcoin teeters on a knife’s edge. At $112,600, the price hangs precariously as the RSI whispers two starkly different futures. Which path will it choose?
Scenario one: a “profit-taking” pullback. Watch for a potential dip to $95,000 if sellers gain momentum. Historycouldrepeat, but no guarantees.
Scenario two: a “bullish bounce.” If the current price floor holds, and a bullish divergence emerges, brace for a surge toward $119,000.
Technical Signals Creating Short-Term Market Sentiment Divergence
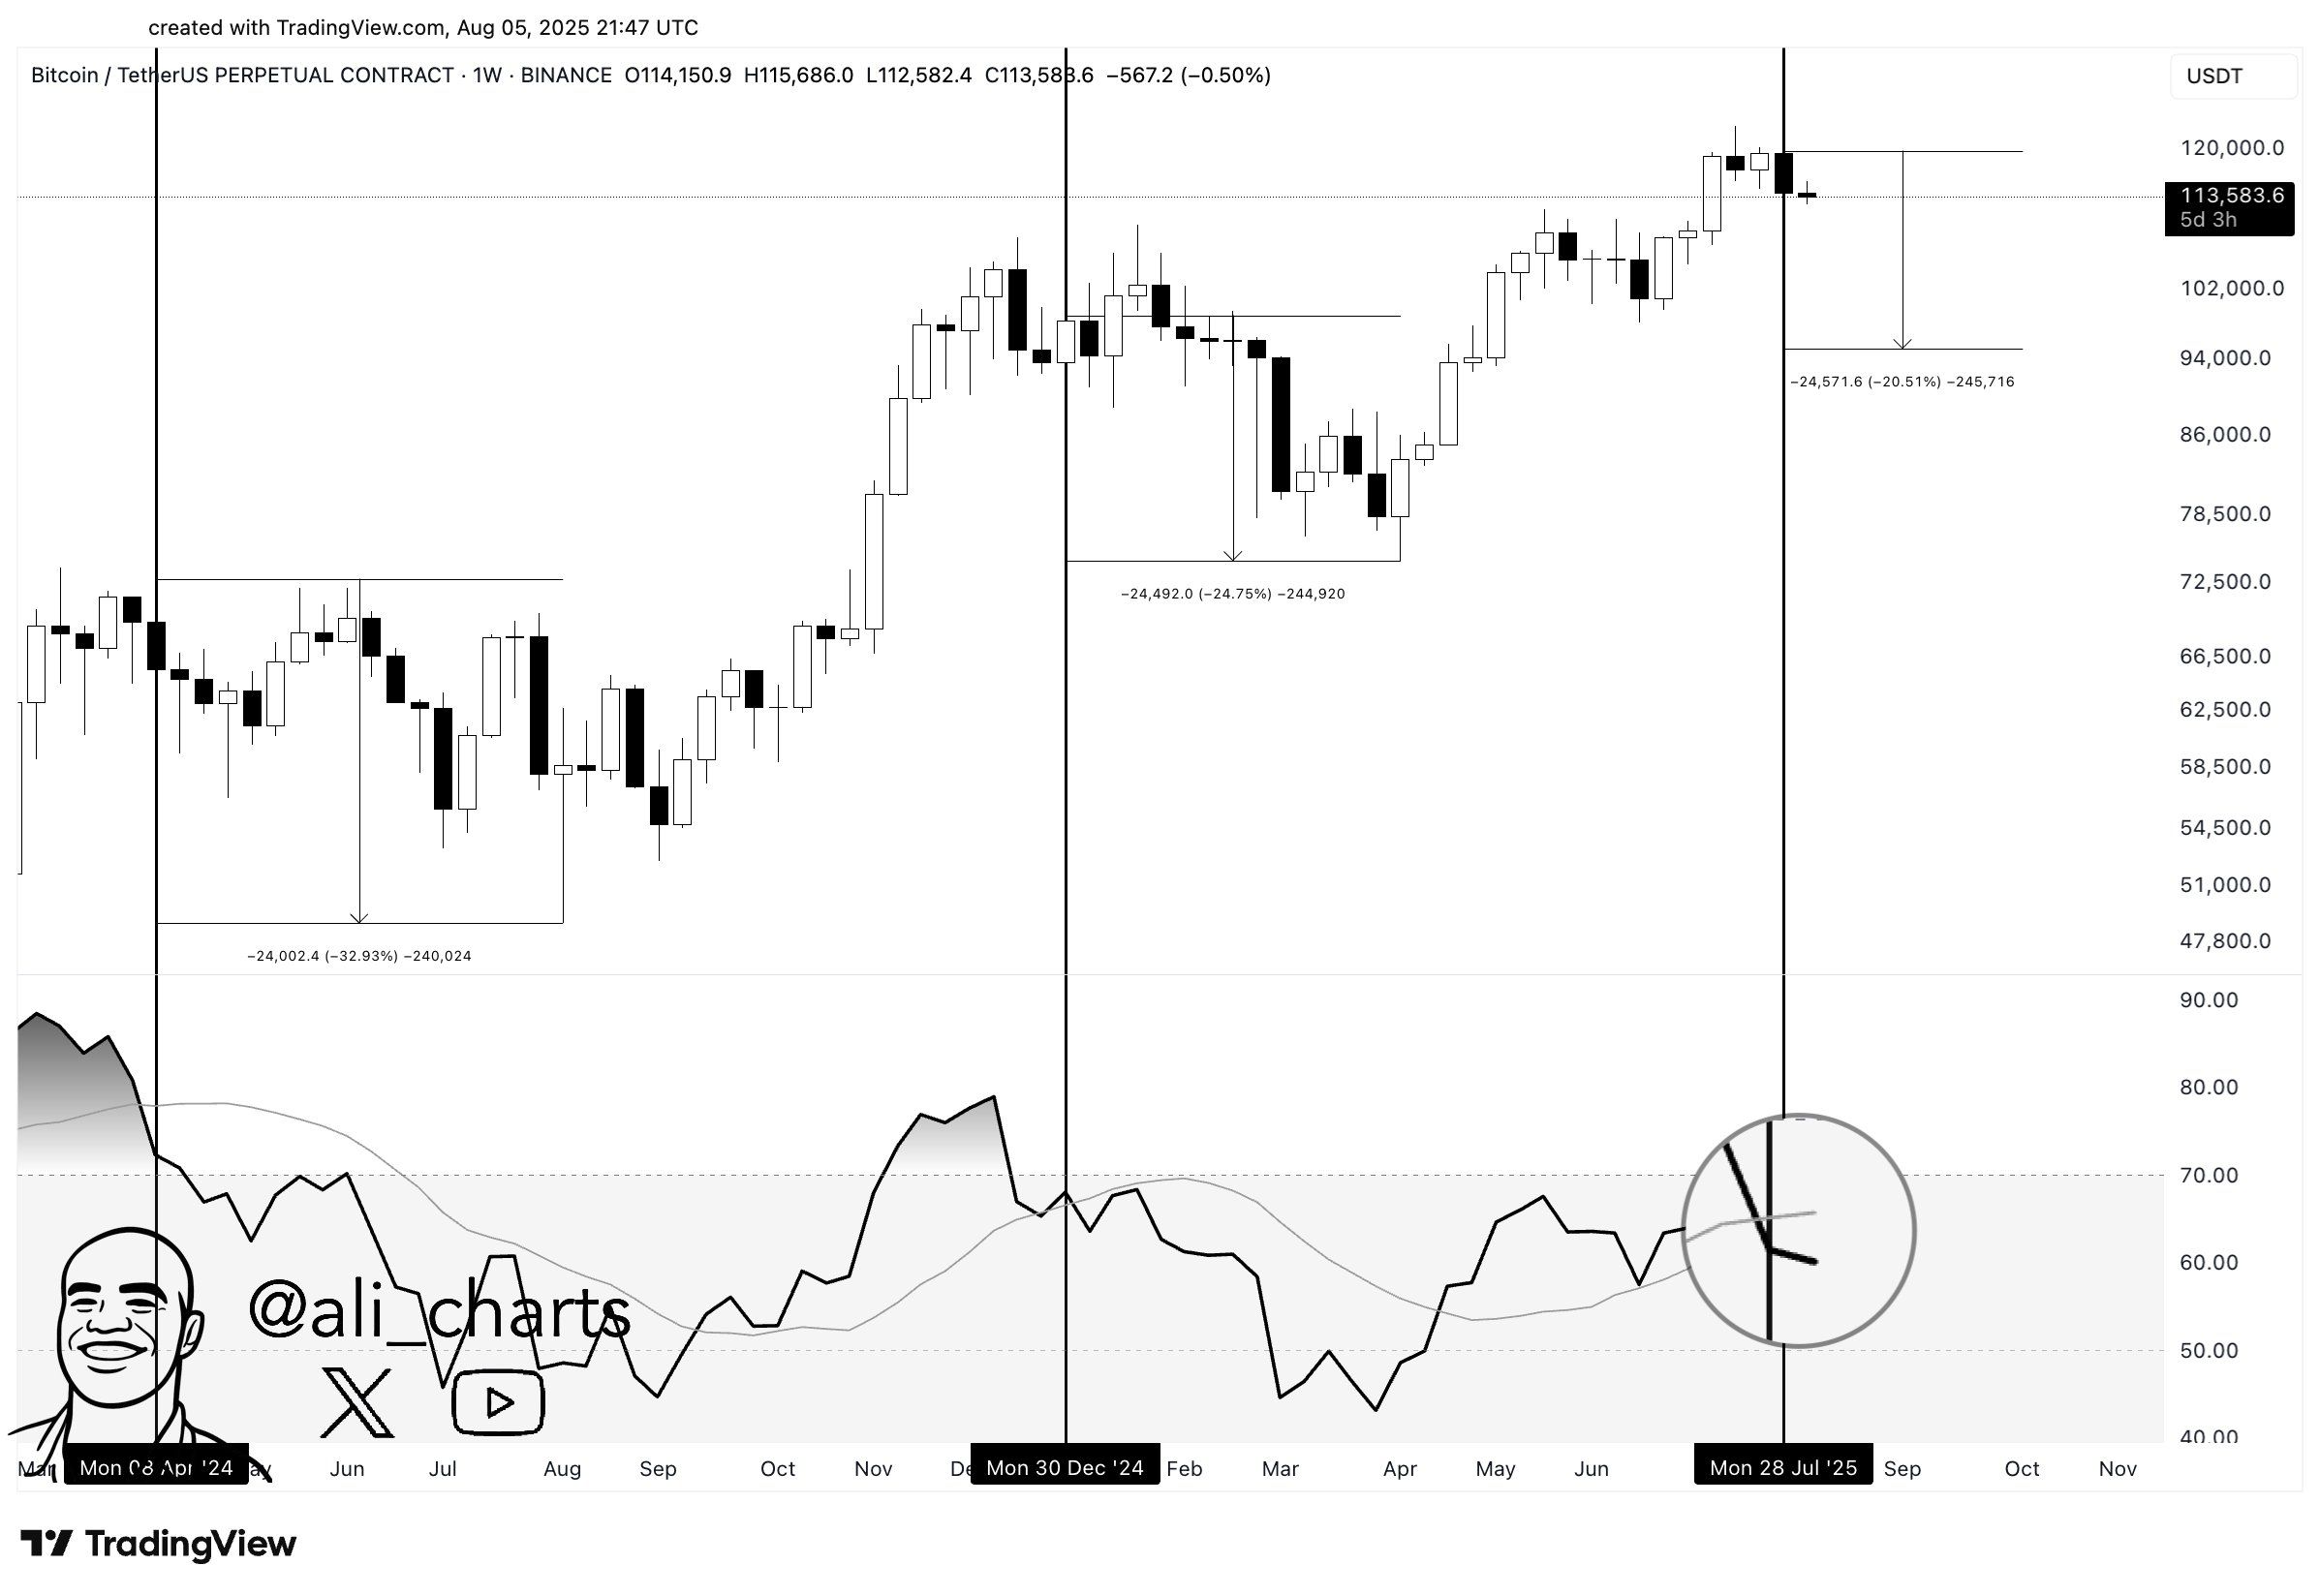
Bitcoin teeters on a knife’s edge, its fate hanging in the balance. Momentum indicators paint a conflicting picture, with the Relative Strength Index (RSI) playing a pivotal role. Analyst Ali highlights a concerning pattern: Twice before, when Bitcoin’s weekly RSI dipped below its 14-period Simple Moving Average (SMA), the market witnessed brutal corrections of 20% to 30%. Is history about to repeat itself, or will Bitcoin defy the ominous signal?

Bitcoin RSI Analysis. Source: Ali
“If history repeats, we could see a move down to $95,000!” Ali commented.
Arthur Hayes, notorious crypto prophet, previously foretold a market bloodbath. But amidst the carnage, he glimpsed a golden future: Bitcoin surging to $100,000 and Ethereum clawing its way to $3,000. Was it a visionary call or reckless speculation? Only time will tell if Hayes’s daring prediction becomes crypto’s ultimate destiny.
Sykodelic’s hawk eyes on the daily RSI chart reveal a compelling narrative: the indicator is flirting with familiar lows. Specifically, it’s mirroring levels seen near the previous ~$98,000 bottom and even brushing shoulders with the ~$76,000 nadir. Translation? The relentless short-term selling might be gasping for breath. This zone could be a strategic launchpad for smart money, a prime opportunity to scoop up assets before the tide turns.
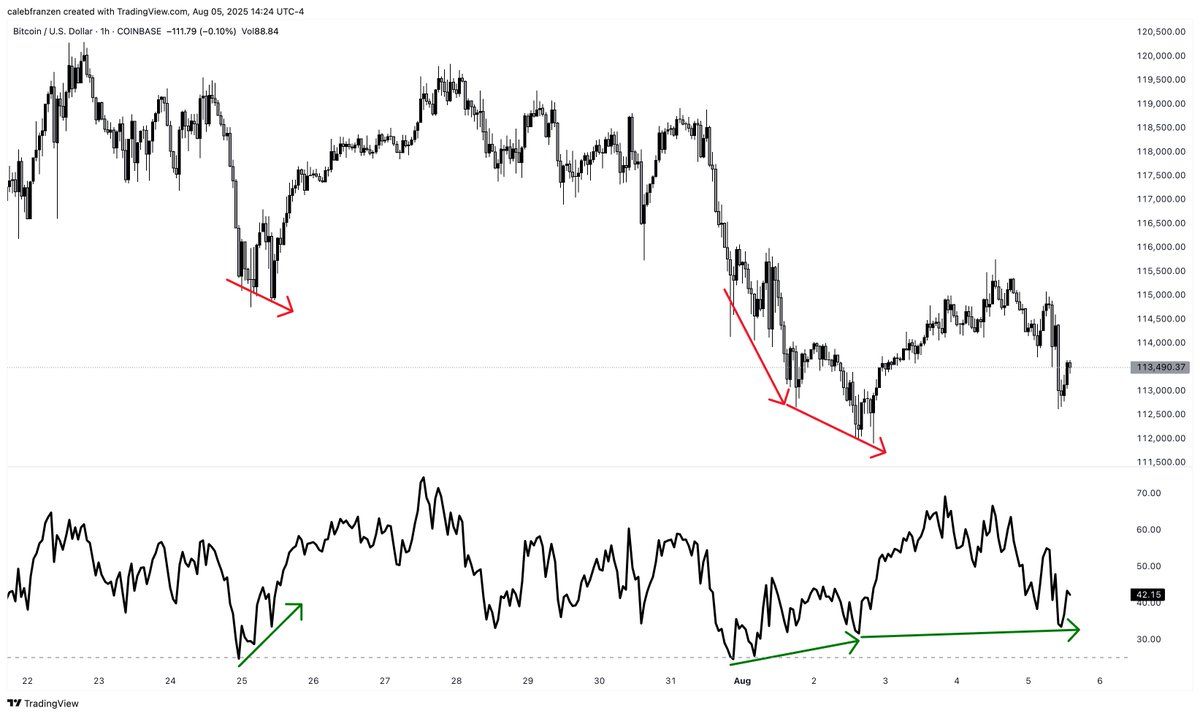
Bitcoin’s recent stumble has chart-watchers scratching their heads. Analyst Caleb Franzen highlights a worrying sign: Bitcoin sliced right through lows that were supposedly propped up by a bullish RSI divergence. Think of it like this: the price was hitting new depths, but the RSI, a momentum indicator, wasn’t echoing the sentiment, hinting at weakening selling pressure. That bullish safety net? Gone. Now, flip the script: imagine the price climbing while the RSI is actually declining – that’s a bearish divergence, a flashing red light warning of a potential price plunge.
Caleb sees a potential launchpad here, projecting a surge back to $119,000. But tread carefully: this level is the make-or-break point. A slip below shatters the bullish dream.

Potential BTC Rebound Scenario to $119,000. Source: Caleb Franzen
A dip to $95,000 could be the market hitting the “refresh” button, allowing sidelined bulls to reload. Conversely, holding steady above $112,600 is vital – it’s the springboard for the next leap forward.
Holding this price level could be the springboard to $119,000, especially if the RSI flashes a bullish divergence. But don’t jump the gun! We need a chorus of confirmations – a surge in volume, cooperative moving averages, and strong daily closes above critical lines in the sand. Without this, the “bounce” could just be a head fake.
Thanks for reading Bitcoin at a Crossroads: RSI Hints at Pullback to $95K or Rebound to $119K


