Ethereum claws back, but can it hold? After a swift two-day surge, Ethereum’s price hovers around $3,634, reclaiming the $3,600 mark. The rally hit a wall at $3,720, running into a double-whammy of Bollinger Band resistance and the 20 EMA. As ETH leaves exchanges and intraday momentum wanes, all eyes are on the critical $3,590 – $3,624 support zone. Will it hold, or is this just a temporary reprieve before another dip?
Ethereum Price Forecast Table: August 6, 2025
| Indicator / Zone | Level / Signal |
| Ethereum price today | $3,634.40 |
| Resistance 1 | $3,720 (Bollinger upper band) |
| Resistance 2 | $3,850 (supply zone) |
| Support 1 | $3,624 (50 EMA) |
| Support 2 | $3,576 (100 EMA) |
| Support 3 | $3,360 (200 EMA) |
| RSI (30-min) | 43.73 (bearish divergence) |
| Supertrend (4H) | Bullish above $3,497 |
| VWAP (Session) | $3,660.77 (neutral) |
| DMI ADX (14) | 18.96 (weak trend forming) |
| Netflow (Aug 5, 05:30) | -$122.70M (heavy exchange outflows) |
| Monthly Fib 0.236 Level | $3,496.72 (macro resistance zone) |
What’s Happening With Ethereum’s Price?
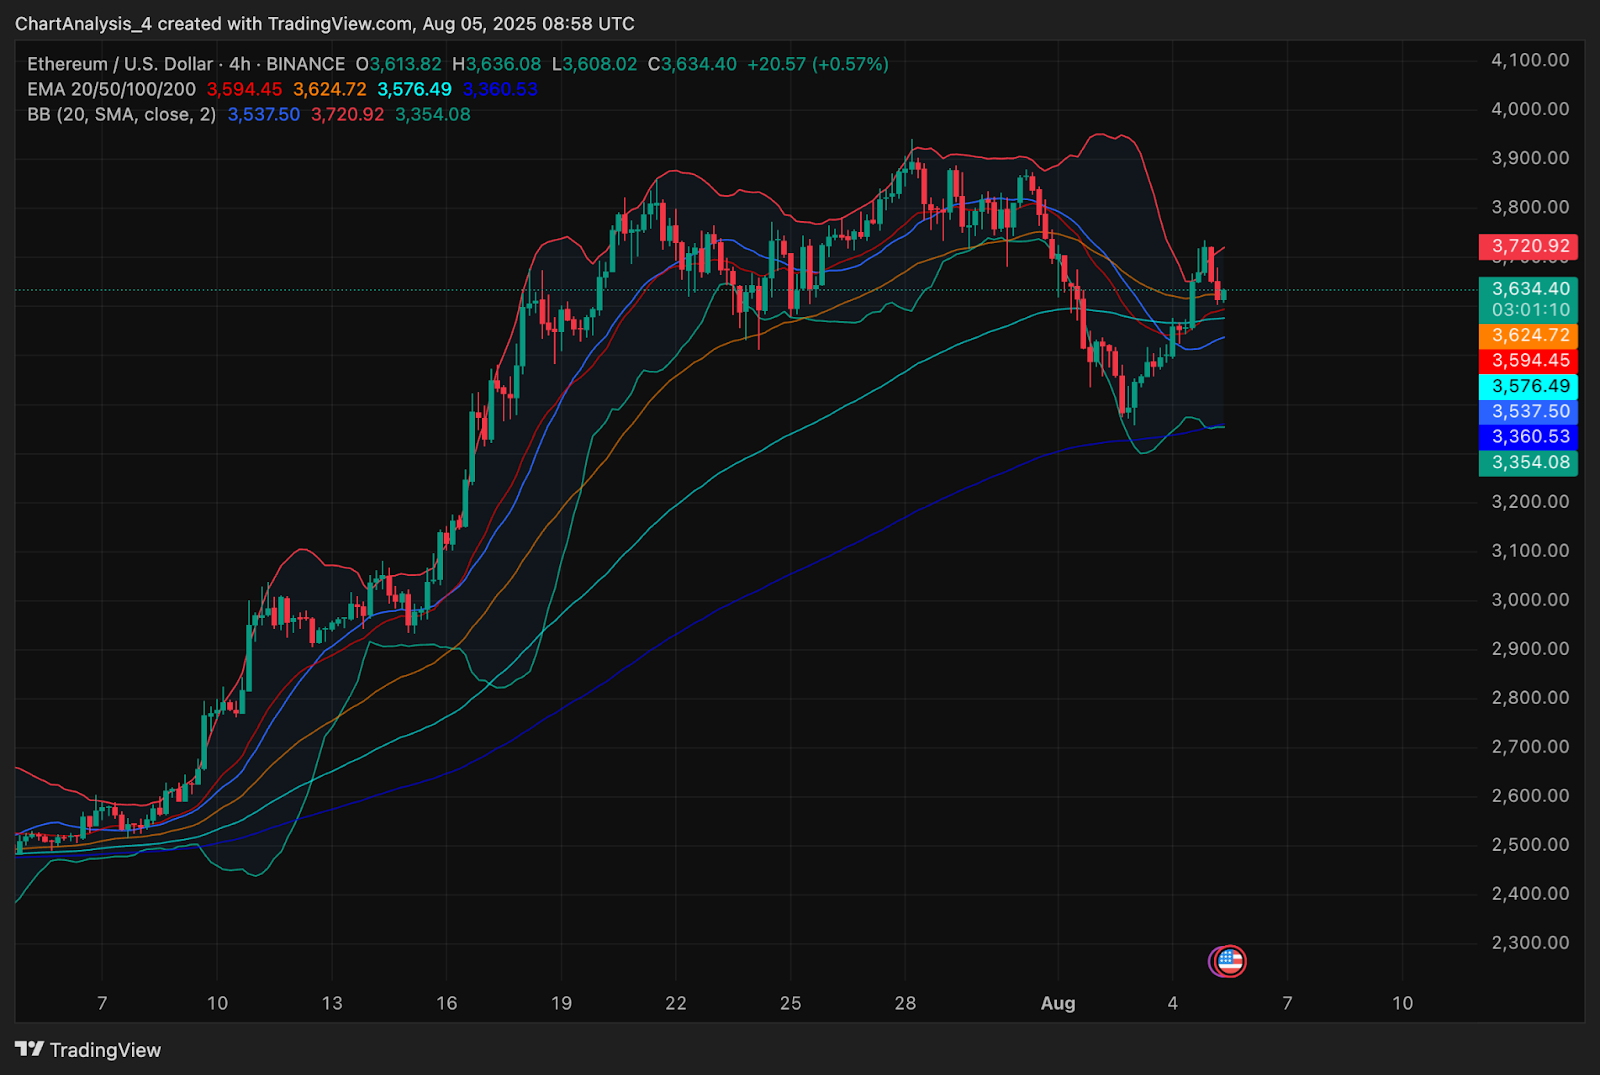
ETH price dynamics (Source: TradingView)
Ethereum’s price chart is painting a bullish picture, bouncing back from the $3,400 mark with impressive vigor. A powerful formation of EMAs – the 100-EMA hovering around $3,576 and the 200-EMA providing solid support near $3,360 – is acting as a springboard. The bulls successfully stormed past the Bollinger Band midline, but their advance stalled at the upper band, a critical resistance zone around $3,720. Can they muster the strength to break through?
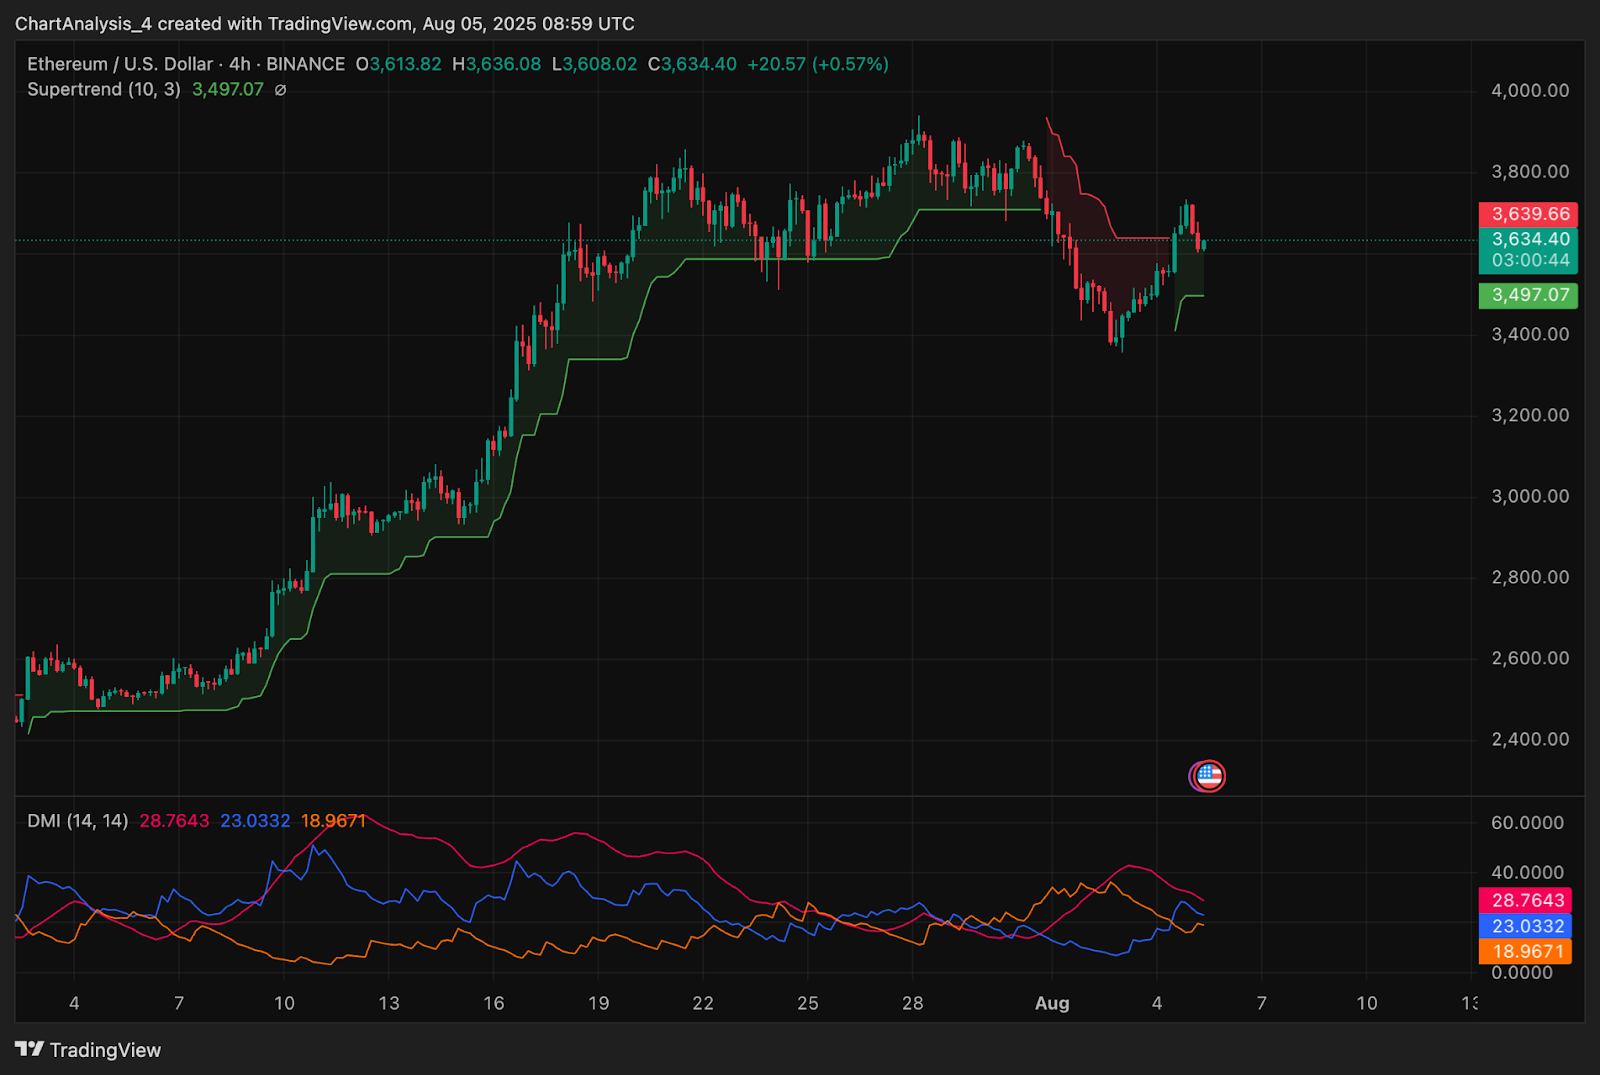
ETH price dynamics (Source: TradingView)
The market’s taken a breather, but don’t get too comfortable. Bollinger Bands are tightening like a coiled spring, hinting at an explosive move soon. Supertrend’s flashing green, planting a safety net at $3,497, which the price is currently testing, get ready.
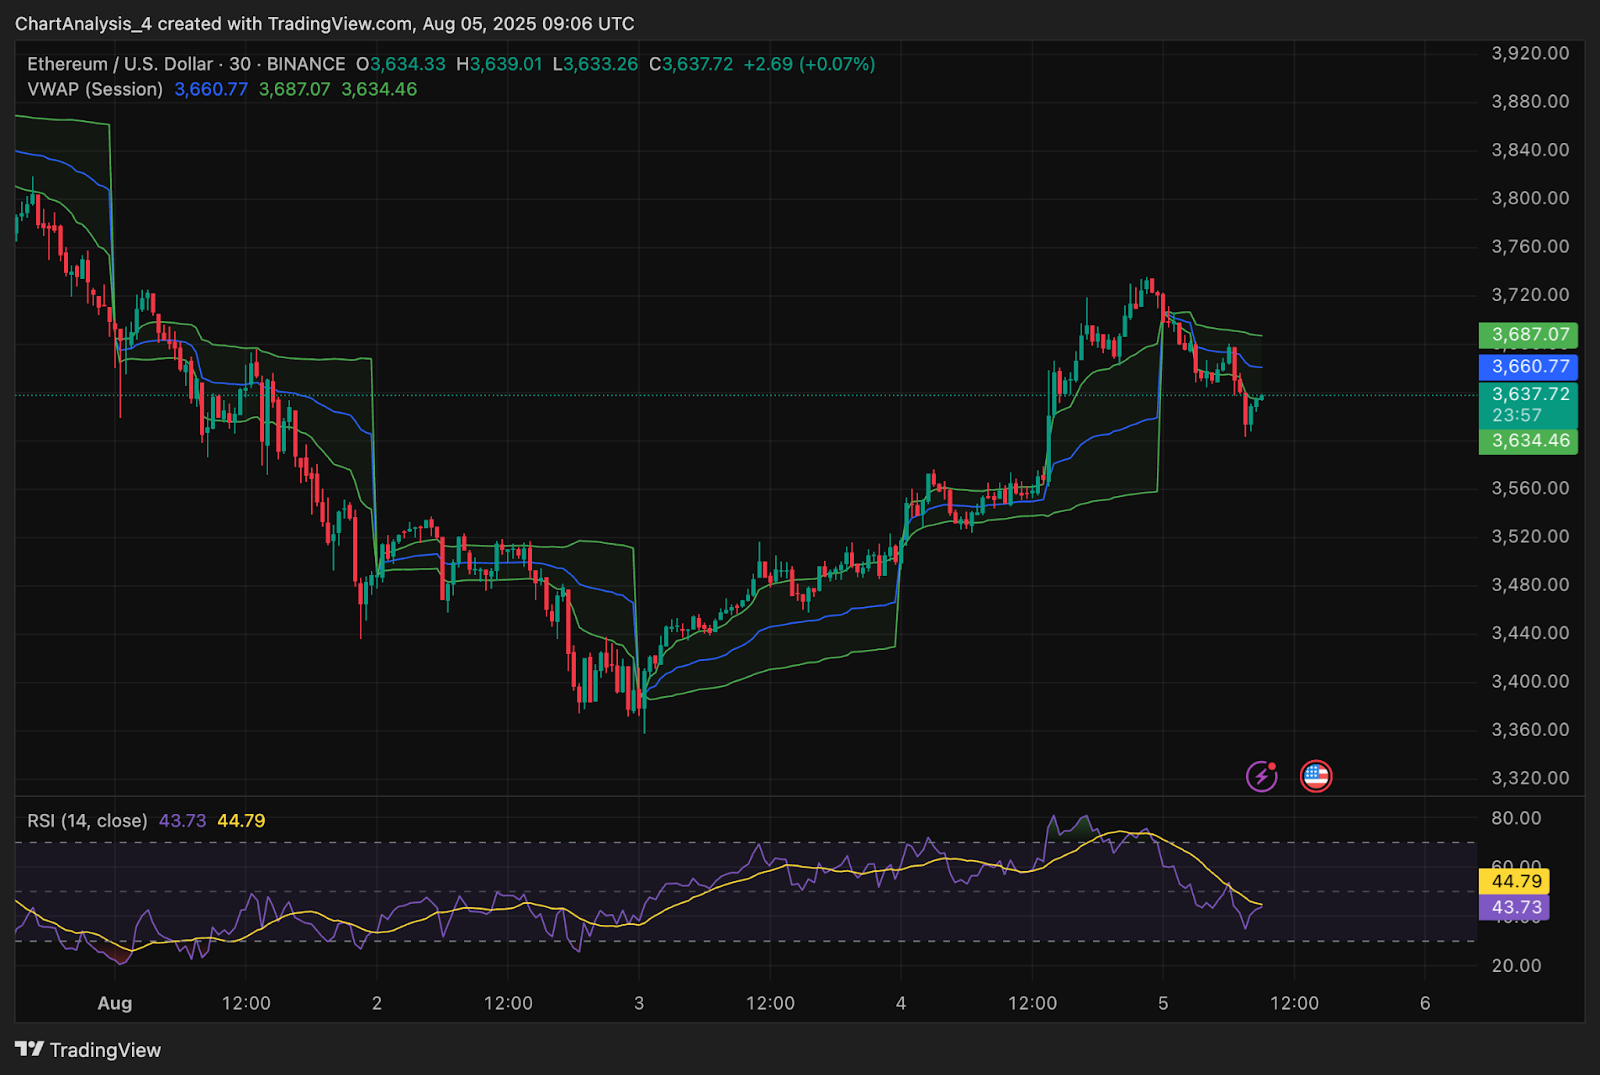
ETH price dynamics (Source: TradingView)
The short-term rally shows signs of fatigue. The 30-minute RSI, now at 43.73, hints at dwindling momentum, while the price dances precariously around the $3,634 VWAP baseline. A closer look at the DMI reveals a faltering advance: the ADX dips towards 19, and the +DI has surrendered its lead to the -DI, suggesting the bulls are losing steam after their initial charge.
Why Is The Ethereum Price Going Down Today?
Ethereum’s price is reeling today, knocked back by a double whammy: technical resistance and a tidal wave of profit-taking. That $3,720-$3,735 range? Think of it as Ethereum’s stubborn ceiling, a level where bulls previously surrendered back in late July. Today’s rally attempted a breakthrough, flashing a promising bullish wick, but ultimately failed to smash through, leaving investors scrambling for the exits.

ETH Netflow Data (Source: Coinglass)
Bitcoin Bleeds: $122.7 Million Exits Exchanges in 24 Hours. The crypto market is bracing for impact as Coinglass data reveals a massive $122.7 million exodus from exchanges in the last 24 hours – the largest outflow in almost three weeks. This sudden surge of coins fleeing the digital wallets suggests a significant increase in selling pressure, threatening to reverse the hard-won 15% gains made since bottoming out at $3,200 in July. Is this the end of the rally, or just a temporary setback before the next surge?
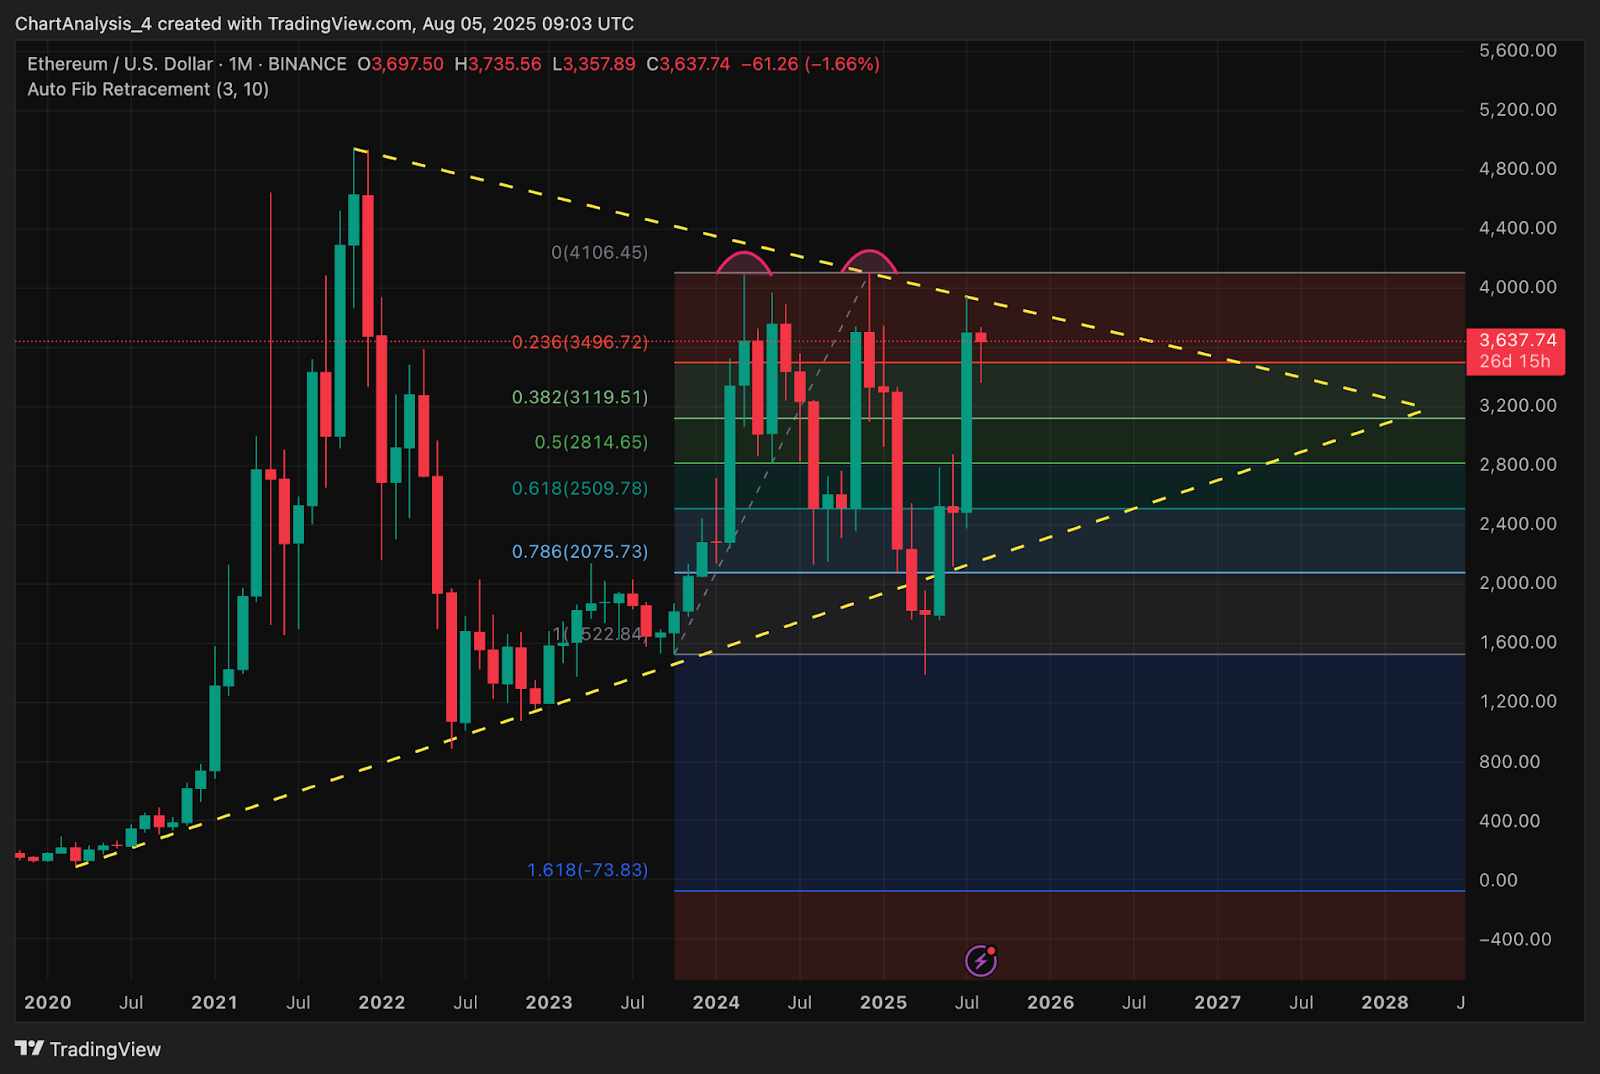
ETH price dynamics (Source: TradingView)
Ethereum’s monthly chart paints a picture of a tug-of-war around $3,496.72. This level, the 0.236 Fibonacci retracement, has repeatedly slammed the brakes on upward momentum since late 2021. Imagine this price point as a stubborn gatekeeper. Zooming out, a long-term triangle formation adds another layer of complexity. Picture a tightening vice, with support compressing near $2,800 and relentless overhead pressure capping gains just shy of $4,100. Ethereum is navigating a maze of resistance, and the breakout direction will be crucial.
Key Levels and Chart Structure to Watch
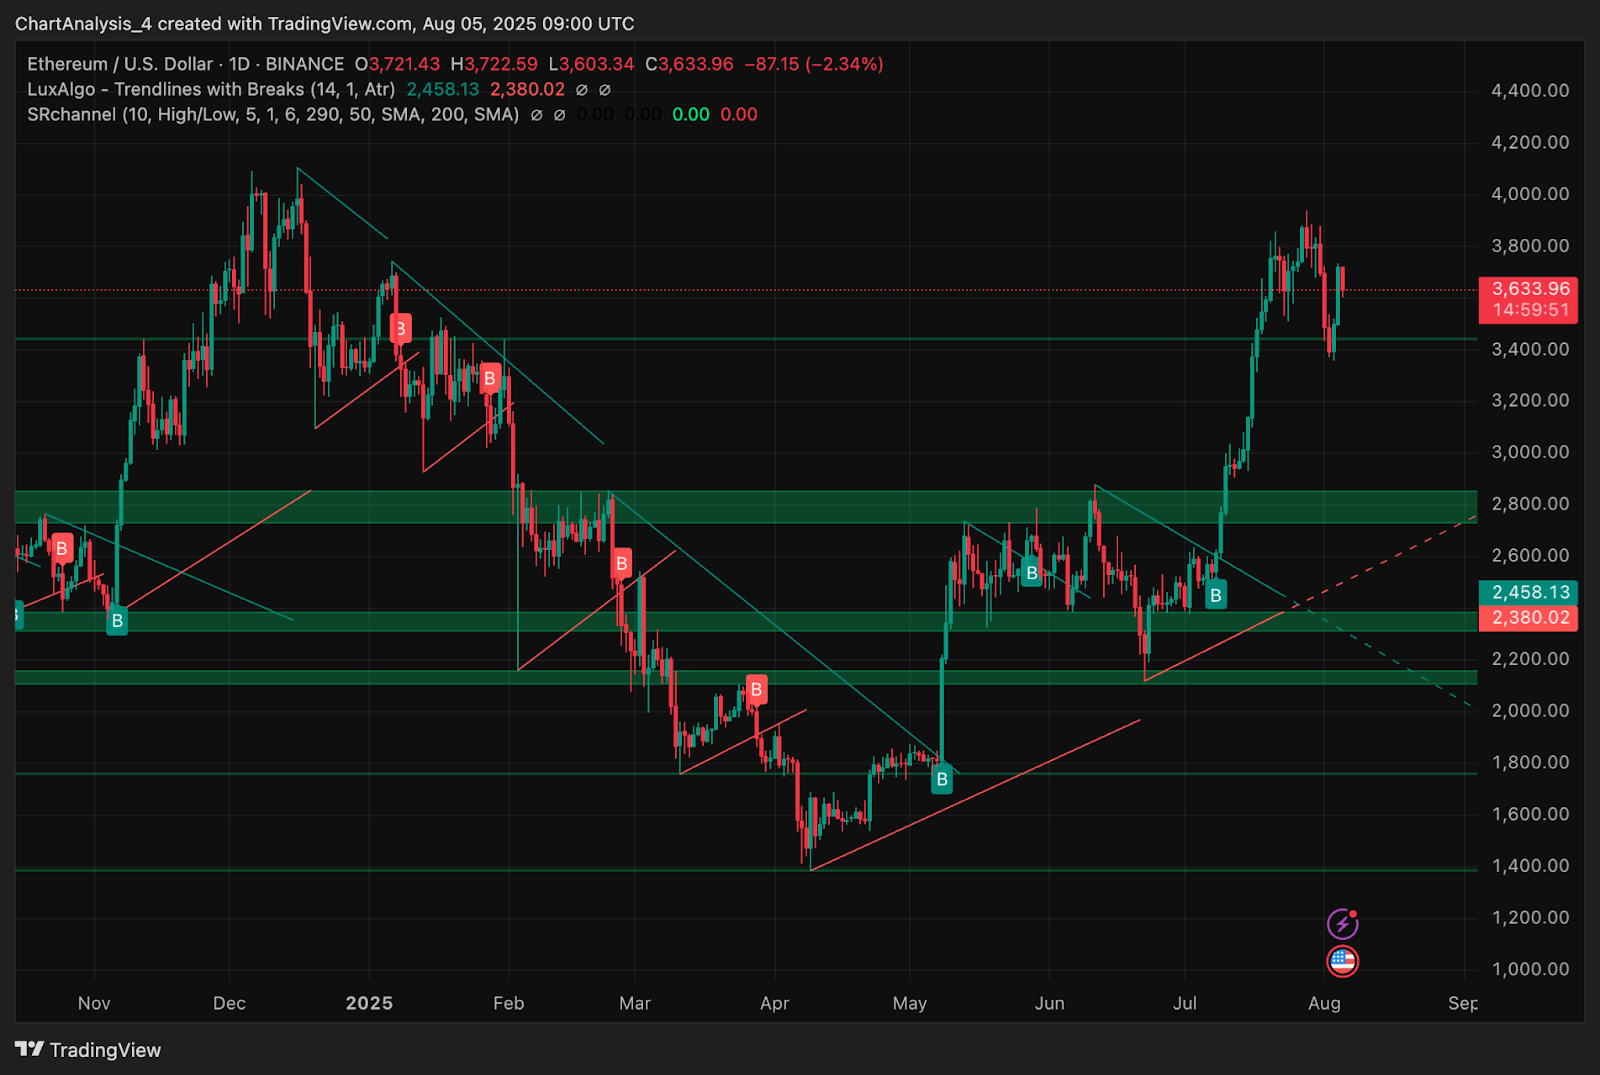
ETH price dynamics (Source: TradingView)
Ethereum’s price action is a high-stakes drama. After July’s breakout from the falling wedge, the daily chart screams “bullish!” But the uptrend’s fate hangs by a thread – a rising support line near $3,400. This level isn’t just a number; it’s the bulls’ last stand. Lose it, and the bears might just crash the party.
On the 4-hour chart, Bitcoin’s price is currently caught in a tug-of-war between vital Exponential Moving Averages. Imagine a coiled spring: the $3,594 (20 EMA) and $3,624 (50 EMA) levels are acting as immediate cushions, preventing a sharp fall. Just beneath, the 100 EMA at $3,576 lurks, ready to catch the price if it slips. Should these fail, all eyes turn to the $3,360 region, where the 200 EMA converges with a previous breakout zone – a make-or-break point for bulls.
ETH’s price is coiling tighter than a spring, trapped within a VWAP channel between $3,660 and $3,687. A failure to break free and reclaim $3,660 in the coming sessions could unleash the bears, driving ETH down towards the juicy liquidity pocket lurking between $3,500 and $3,520.
ETH Price Prediction: Short-Term Outlook (24H)
Ethereum’s price is teetering on a knife’s edge. Hold tight above $3,590 – $3,624, and we might just see another push for $3,720. But here’s where it gets exciting: Smash through that ceiling, and with bullish signals from the RSI and MACD, we could be looking at a rocket ride to $3,850, then onward to the coveted $4,000 mark. Keep your eyes peeled!
However, a fall below $3,576 could signal a sharper drop, potentially testing the $3,360 area around the 200-day EMA. Breaching this level would shatter the current bullish momentum, raising the specter of a return to the $3,200 support trendline.
Ethereum teeters on a knife’s edge. Bleeding netflows and sputtering momentum have set the stage for a dramatic 24 hours. Watch for a decisive surge past $3,720, signaling a potential bullish rally, or a plunge below $3,576, foreshadowing further descent. The next tick could dictate Ethereum’s fate.
Thanks for reading Ethereum (ETH) Price Prediction for August 6
