Related Articles


Ethereum price must have been flirting just under $2,700-against the strength of such resistance. After a tremendous surge from just below $2,100 in early May, the ETH has been now testing the waters and flirting with a breakout. The 2,722 high found immediate resistance, so let us say that a battle is underway at this level. But, herein lies the irony: This rally just pushed ETH back into a long-term descending resistance area. On May 15, all eyes will be on whether or not Ethereum will clear and confirm the trend reversal or get sent back down. High stakes!
What’s Happening With Ethereum’s Price?
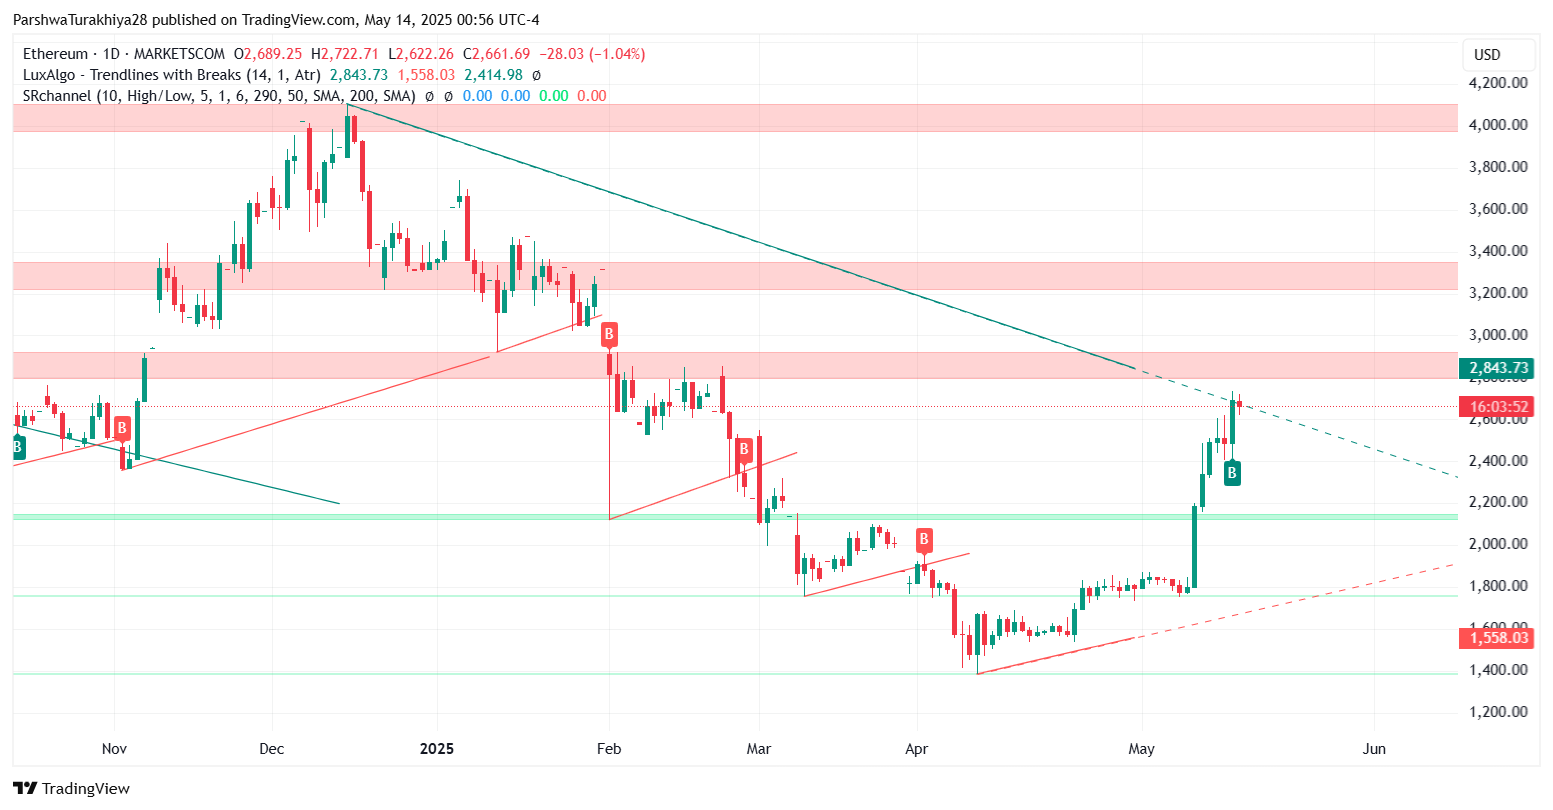
ETH/USD price dynamics (Source: TradingView)
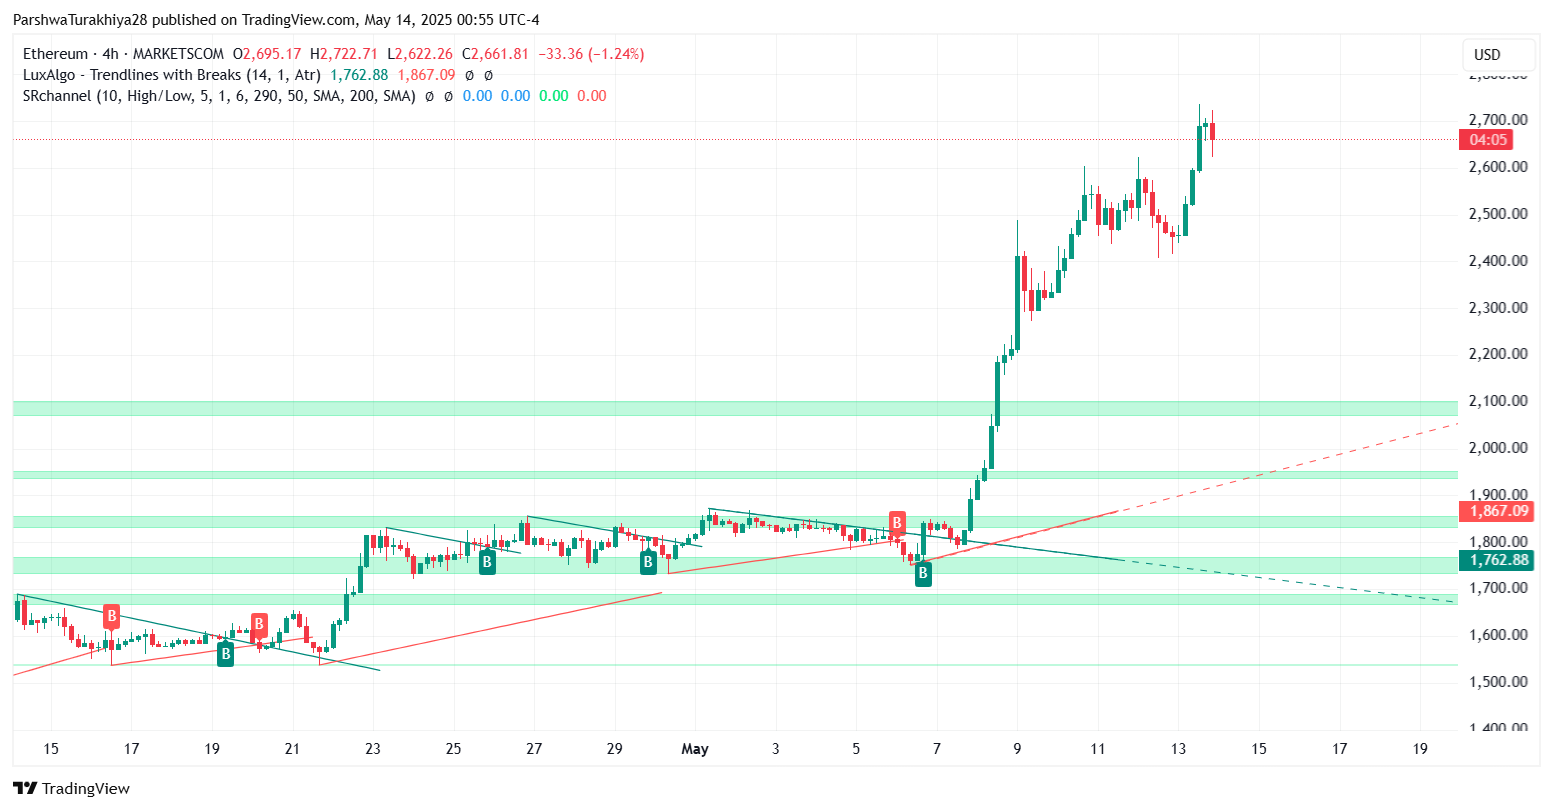
Here comes the resurgence of Ethereum after busting free from months of downward action-we have bullish indications on the charts. The daily chart depicts resistance for ETH from a slanting line stemming from November’s November 2023 top. This crucial level, set about $2,720–$2,750, is reinforced by a vital Fibonacci level ($2,745) from the weekly chart. Should Ethereum shore up beyond this resistance, it may eye a big price jump.
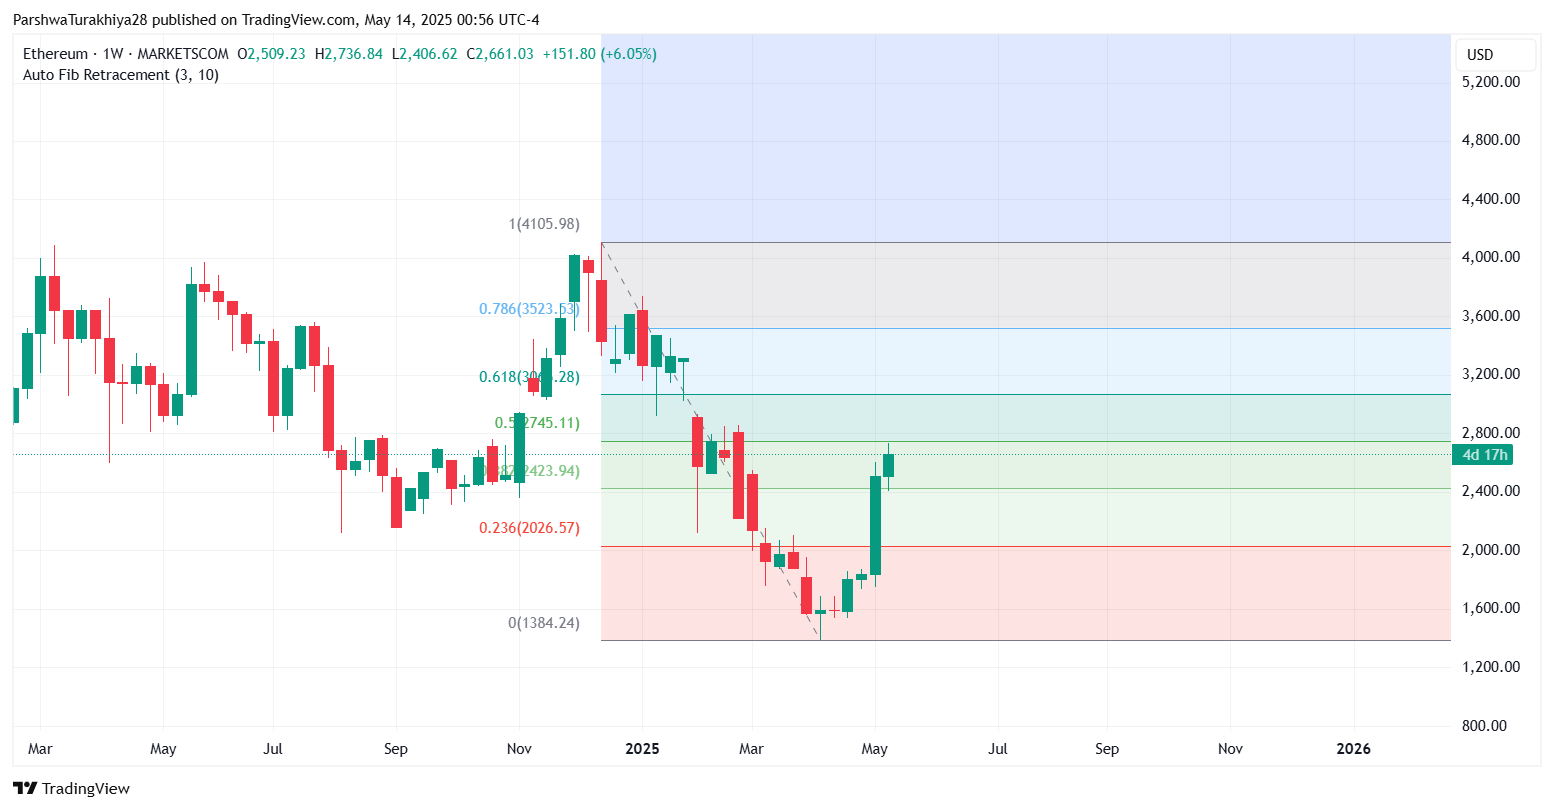
ETH/USD price dynamics (Source: TradingView)
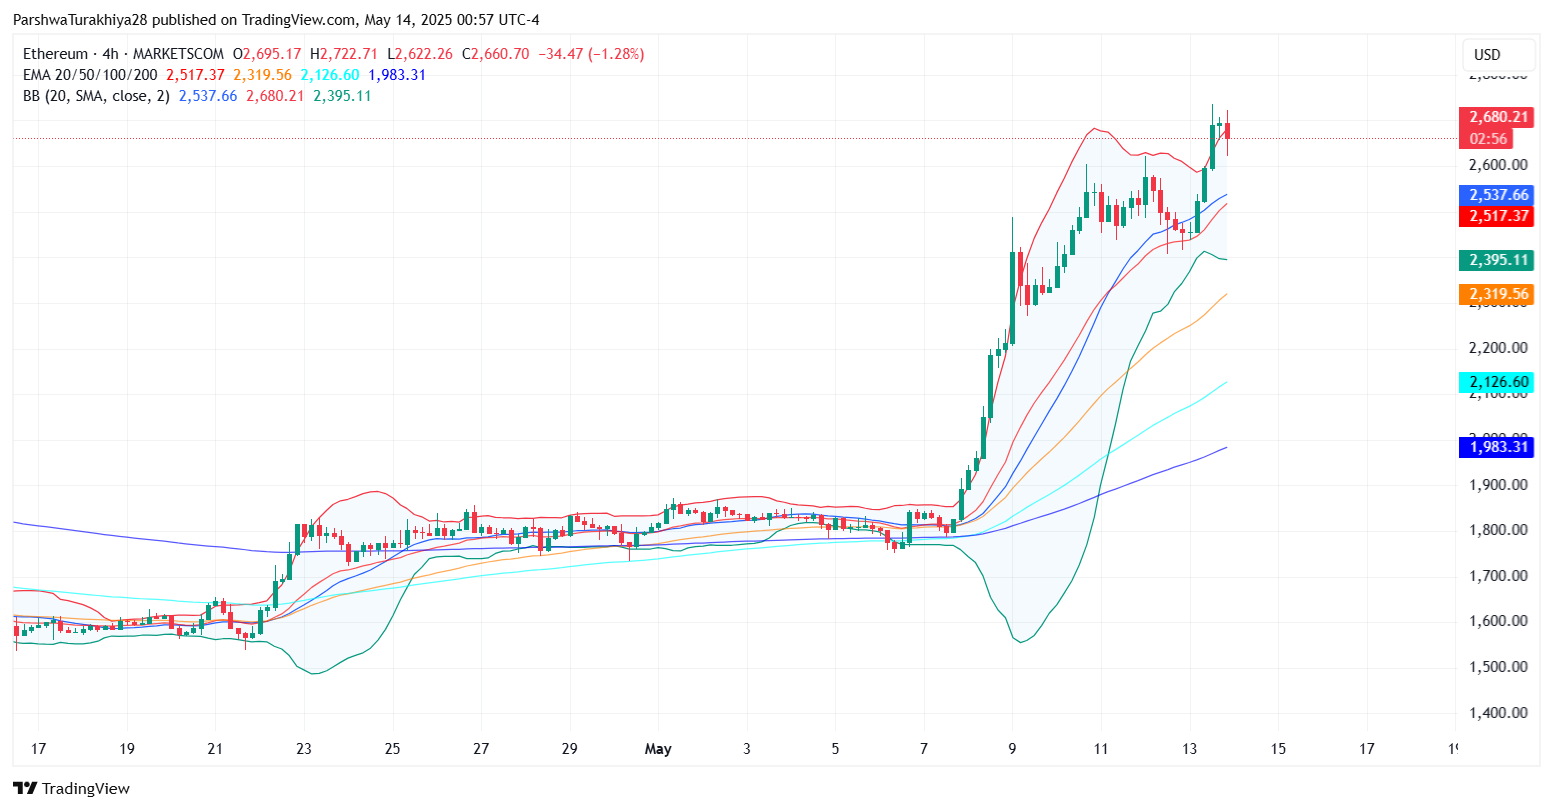
Ethereum bulls are back in town after the candle surge of this week tested key Fib levels (0.382 and 0.236) as this appears to be no dead cat bounce but a complete trend reversal. However, problems come for the bulls at the upper Bollinger Band of $2,680 on the 4-hour chart, acting as an immediate ceiling for the rally.
Ethereum Price Action: Sideways Bias Ahead of Breakout
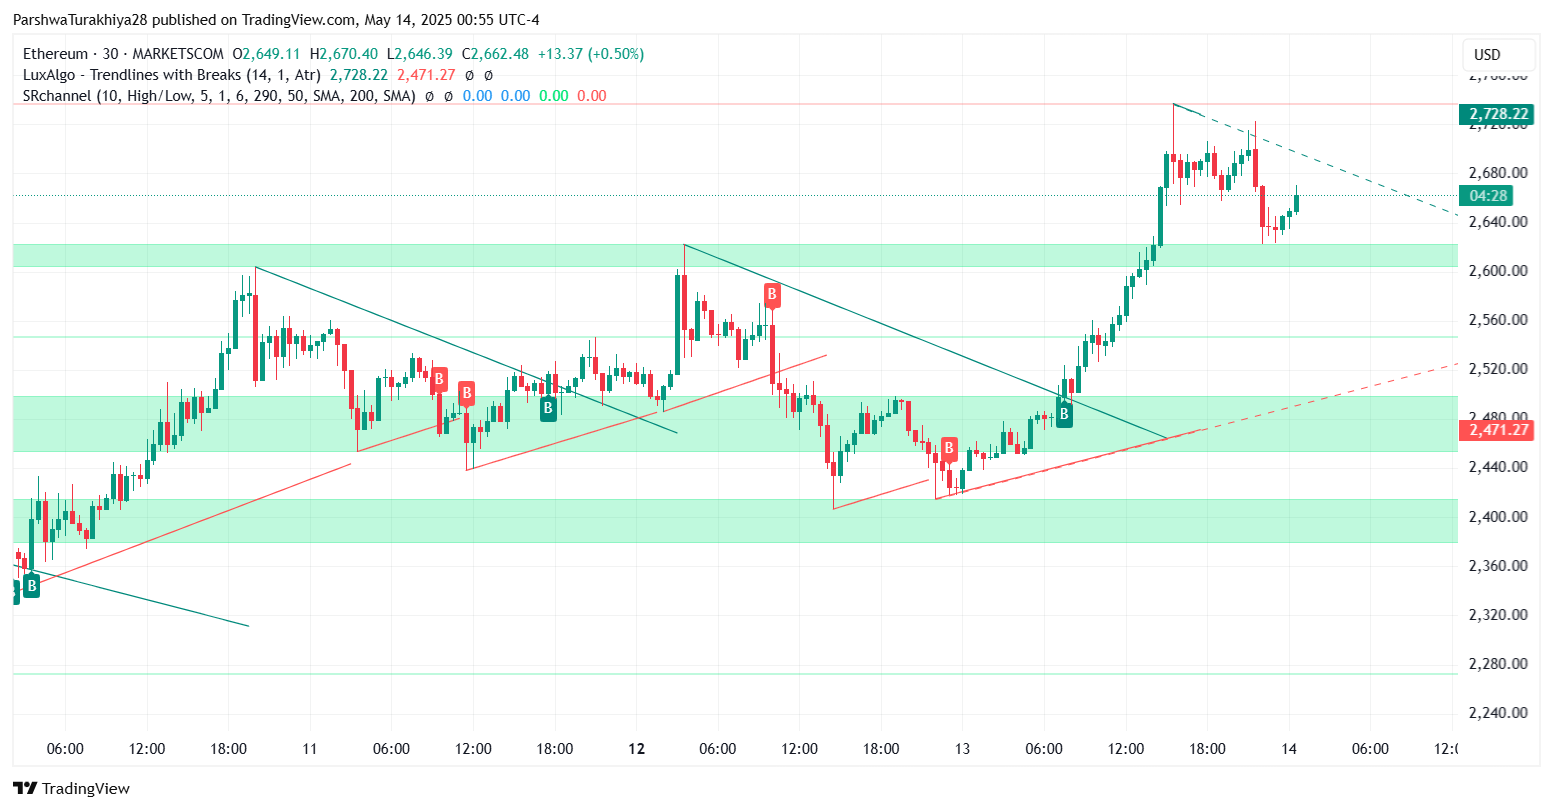
ETH/USD price dynamics (Source: TradingView)
ETH’s coiled spring is about to launch! Bull flag patterns blaze on both the 30-minute and 4-hour charts, indicating the possibility of an explosive breakout if volume increases. Watch closely as the candles squeeze just below the $2,680–$2,700 resistance wall. Immediate safety would lie around $2,610–$2,640, but keep an eye on the 20 EMA of the 4-hour near $2,517, ready to catch ETH should it decide to take a break.
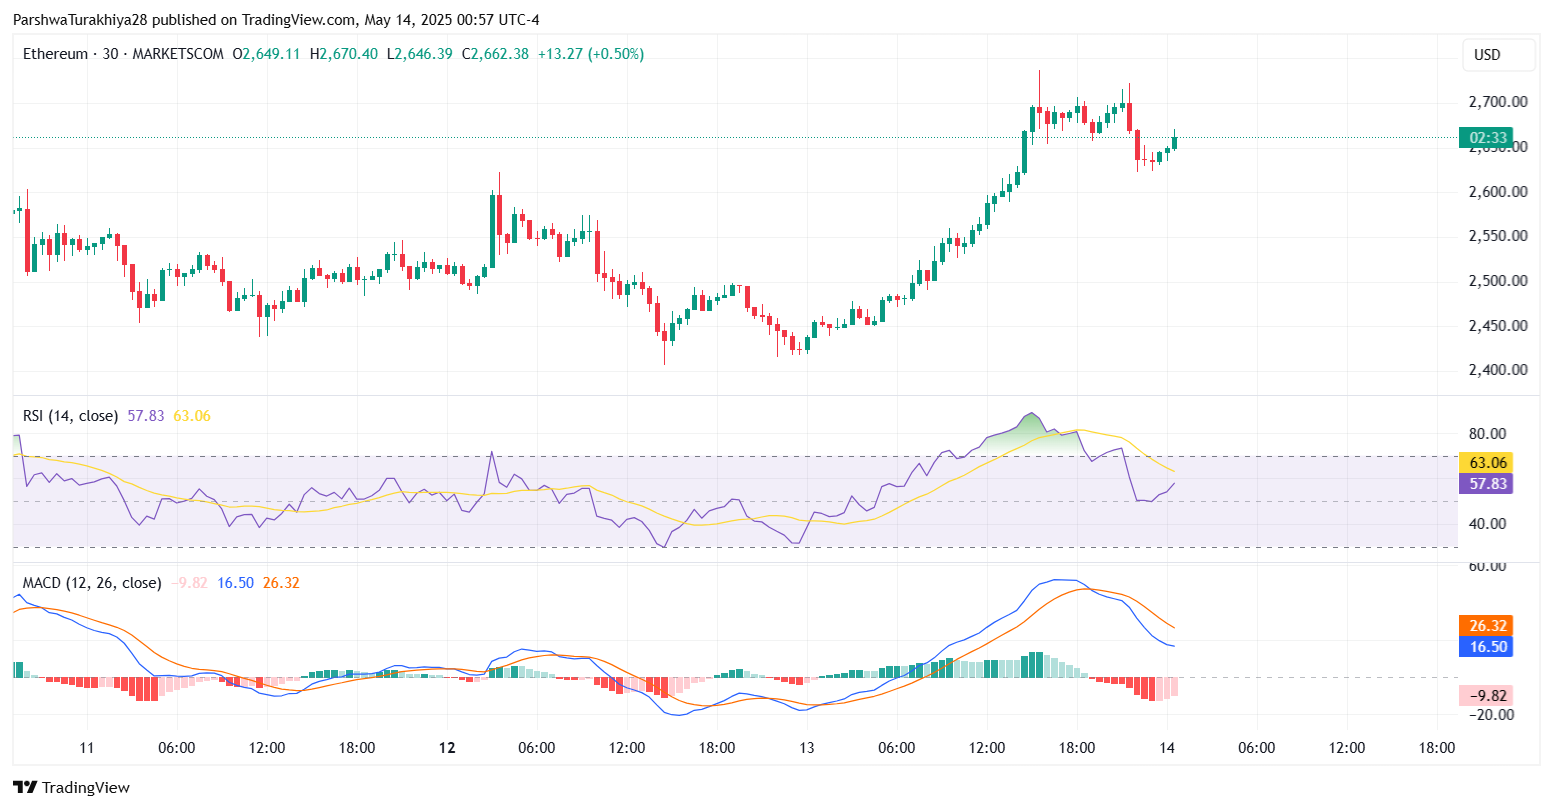
ETH/USD price dynamics (Source: TradingView)
The 30-minute RSI just exhaled as the reading dropped to a more sustainable 57.83 after flirting with overdemand conditions above 63. Translation? A brief pullback may well precede the resumption of the rally. The MACD is whispering too: the histogram thinning hints at a potential bearish crossover. It isn’t a full-blown siren just yet, so have a look.
A bit of a pause is expected from last week’s surge in Ethereum. The Bollinger Bands on the 4-hour chart are tightening in concentration, suggesting a possible breather before the next volatility storm hits. Is Ethereum winding up for another big smash? Only time will tell.
Why Ethereum Price Going Down Today?
ETH/USD price dynamics (Source: TradingView)
Ethereum’s bull run rungets! Why was there a dip? Given the rupture from the $2,100 trenches and a royal fare through $2,400 and $2,600, the surge of Ethereum appears to have met resistance. Then it looks so hard to break above $2,720, which has acted as the short-term resistance. Is this just a breather before another leg up, or are the bulls losing steam? One can observe that the daily and weekly chart windows reveal the confluence of horizontal-and-diagonal resistance around $2,720-$2,750. Stay glued!
Ethereum is staying firm above the significant levels of EMAs -50 EMA of $2,319 and 100 EMA of $2,126. Bulls can celebrate because, as long as ETH maintains the price within the $2,610-$2,640 range, the advantage will remain theirs. Beauty lies in the eyes of those who win; thus, winning over $2,750 will pry open the door to $2,843, while $3,080, which is the 0.618 weekly Fibonacci level, lies beyond.
Short-Term Ethereum Price Outlook for May 15
ETH/USD price dynamics (Source: TradingView)
Ethereum is coiling up like a spring tucked in upwards, ready to lash out in either direction. All eyes are on the $2,700-$2,745 ceiling; if bulls can break that with force, then $2,843 becomes a stepping stone towards the $3,000 target-a zone that has weekly resistance. But beware; if that pitch won’t happen, then a drop below $2,610 could lead to $2,517 prices, or even $2,480. The real fight for Ethereum’s future is about to begin.
Ethereum much more delicately balanced than it was before! The bullish flag formation shows some sign of possibly soaring upwards; however, fracture lines could see it plummeting fast. Keep your eyes glued on the RSI and the MACD for momentum swings during the day. Just as if volume itself had a pulse, watch it closely whilst the price ticks at the critical breakout mark of $2,700. The fortune stands for whoever is most alert, be it bull or bear.
Ethereum Forecast Table: May 15
| Indicator/Zone | Level (USD) | Signal |
| Resistance 1 | 2,720–2,745 | Breakout trigger zone |
| Resistance 2 | 2,843 | Weekly target/resistance |
| Support 1 | 2,610–2,640 | Local support cluster |
| Support 2 | 2,517 | EMA20/Breakdown trigger |
| RSI (30-min) | 57.83 | Cooling from overbought |
| MACD (30-min) | Mild Bearish | Momentum slowing |
| Bollinger Band Width | Tightening | Volatility contraction |
| Pattern | Bullish Flag | Breakout likely if volume rises |
In every manner of trading, investing, and whatnot comes with all risks. This was not a piece of financial advice; this is an educational content provided by Coin Edition. Should any person wishing to use the information lose money, this cannot be contested against us. Think before you leap – do your own research.
Thanks for reading Ethereum (ETH) Price Prediction for May 15

