Related Articles


Ethereum Knocks on $3,000’s Door: Can it Break Through?
After months of anticipation, Ethereum has finally kissed the $3,000 mark, fueled by a potent cocktail of institutional excitement surrounding Spot Ethereum ETFs and Bitcoin’s record-breaking surge. Will this be a fleeting encounter, or can ETH smash through this resistance and claim new heights?
Ethereum Tears Past $3,000: Is a Record-Breaking Rally Next?
Ethereum is on fire! The cryptocurrency has exploded over 17% in the last week, smashing through resistance to hit a local peak of $3,065. But the real story is unfolding on the charts. Eagle-eyed analysts are spotting classic bullish patterns, suggesting this surge is just the beginning. Are we about to witness a historic climb that sends ETH to uncharted territory? Two technical formations suggest the bulls are ready to stampede, paving the way for a potentially massive rally.
Cup And Handle Pattern Points To $4,200 If Breakout Holds
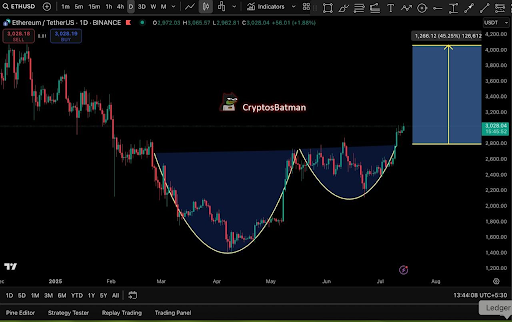
Ethereum is brewing a potentially massive rally, and eagle-eyed traders are spotting the pattern. On X, @CryptosBatman highlighted a textbook ‘cup and handle’ formation playing out over the last four months. Imagine a teacup: ETH formed a smooth, rounded bottom since early March, dipping to a low of $1,400, before consolidating into a neat little handle. Now, ETH has shattered the $2,850 neckline, signaling a breakout. If this pattern holds true, brace yourselves: the technical target points to a 45% surge, potentially pushing ETH to just under $4,200.
Ethereum Poised to Shatter Records: Is a New All-Time High Imminent?
Forget Bitcoin, all eyes are on Ethereum. One analyst is pointing to a confluence of powerful forces suggesting a major price surge is on the horizon. A classic “cup and handle” breakout, combined with compelling on-chain data, paints a bullish picture. Ethereum is not only eclipsing Bitcoin in short-term gains, but exchange reserves have plummeted to levels unseen in eight years, signaling a steadfast HODL mentality and dramatically reduced selling pressure. According to @CryptosBatman, this potent cocktail of technical and fundamental factors could propel Ethereum to break its all-time high, potentially before the close of Q3. Is Ethereum about to steal the spotlight?
Weekly Chart Echoes Previous 42% Rally
CryptoBullet, a prominent market technician, echoed this bullish sentiment on X, spotlighting Ethereum’s weekly chart. His analysis hinged on last week’s explosive green candle, a force that shattered the $2,850 resistance zone, paving the way for further gains.
The chart whispers a bullish echo: a pattern strikingly similar to the one that ignited a 42% ETH rocket between February and March 2024. Back then, ETH blasted off from $2,900, soaring to almost $4,100 in a breathtaking climb that left onlookers breathless. Is history about to repeat itself?
Ethereum’s poised for a potential surge. If history repeats itself, we could see it testing $4,200 by August 2025. Imagine a 42% climb from the current breakout point! This projection hinges on a crucial factor: $2,800. Once a stubborn ceiling, this level now needs to act as a firm floor, holding off any significant dips below the $2,850 – $2,900 zone. Keep a close watch; the next few weeks could be pivotal.
At the time of writing, Ethereum is trading at $2,980, having reached an intraday high of $3,074.

Featured image from iStock, chart from Tradingview.com
Thanks for reading Ethereum Forms ‘Pure Cup And Handle’ Pattern After Hitting $3000 Analysts Set New Targets

