Related Articles

Remember when PEPE exploded onto the scene, defying logic and sending crypto enthusiasts into a frenzy? Well, the meme coin darling is back in the spotlight, but this time, the tune is less of a triumphant fanfare and more of a suspenseful drumroll. After a blistering rally, PEPE’s price is currently locked in a tense consolidation, leaving traders wondering: is this the eye of the storm before another monumental surge? Or is the frog finally croaking its last bullish note? We’re diving deep into the charts, dissecting both the shortterm flutters and longterm trends, to unearth the potential fate of PEPE. Buckle up, because this meme coin saga is far from over.
PEPE Price Prediction: What Does the Hourly Chart Say?
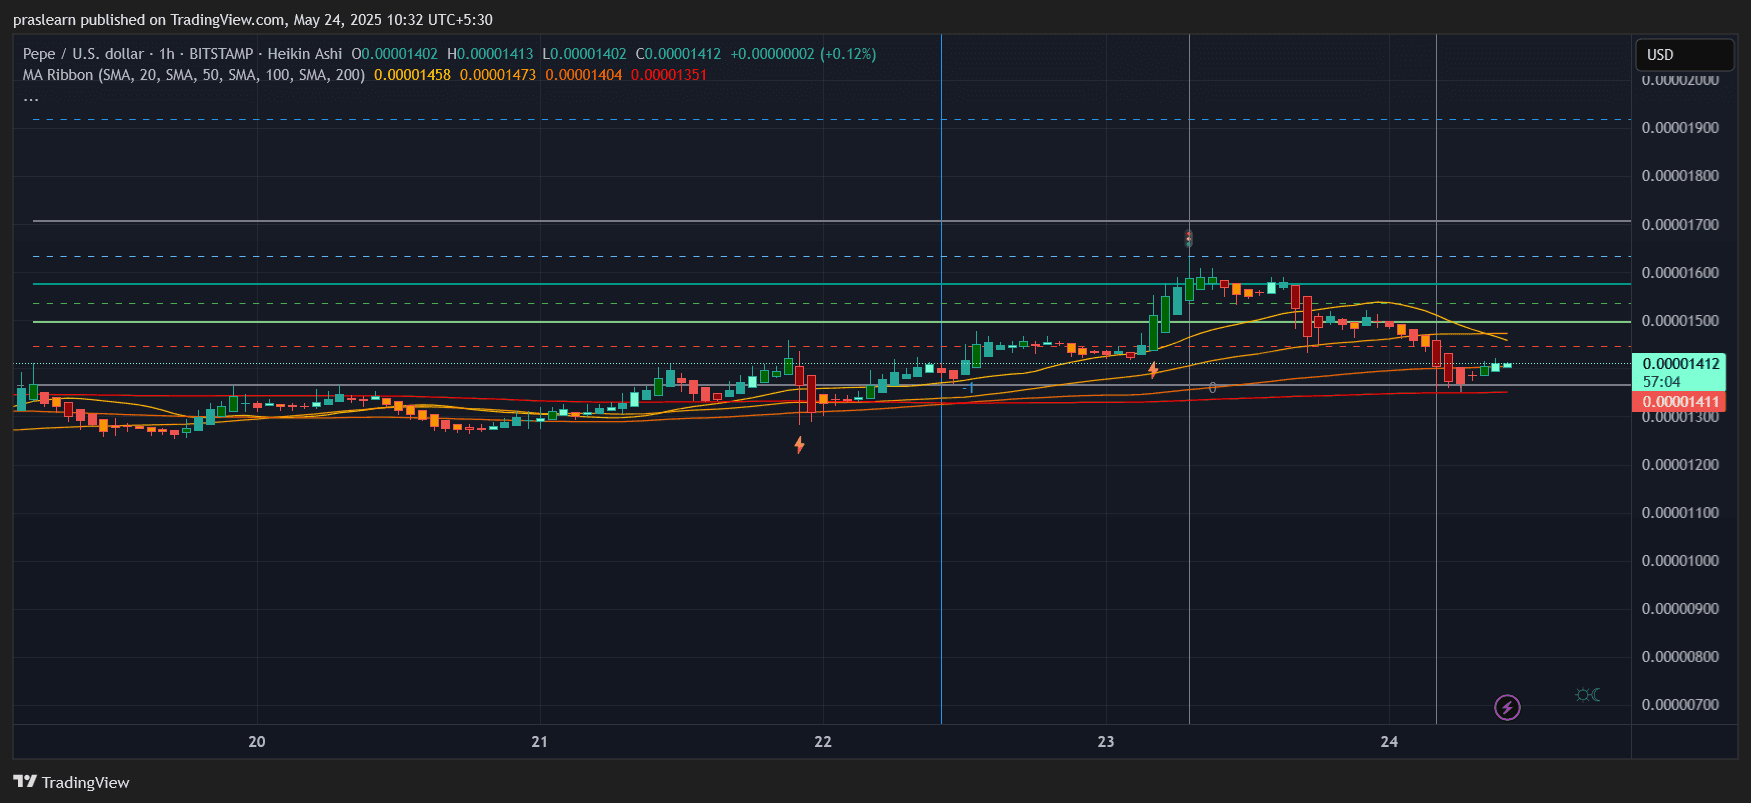
PEPE/USD 1 Hr Chart- TradingView
PEPE’s hourly chart paints a picture of a meme coin catching its breath around $0.00001412. Fresh off a dizzying climb that briefly pierced the $0.00001600 ceiling, PEPE has retreated slightly, now finding solace just above the $0.00001400 support line. Is this a moment of calm before another surge, or a sign of exhaustion? Only time will tell.
We notice PEPE price action closely interacting with key moving averages:
- The200 SMA(currently near$0.00001351) is acting as dynamic support.
- The50 SMAand100 SMAare slightly overhead, around$0.00001404and$0.00001473, respectively.
PEPE is staging a comeback, battling to reignite short-term fire. The 20-day SMA, tilting skyward ever so slightly, acts as a silent guardian. A breach below $0.00001350, however, would signal a deeper structural crack.
“$0.00001400: The line in the sand? A flurry of red candles tested the resolve of the bulls, but a faint bullish flicker at this level suggests a potential turning point. Is it a reversal in the making, or simply a brief respite before the next wave? Buyers appear to be digging in their heels, attempting to establish a temporary foothold.”
What’s Happening on the Daily Chart?
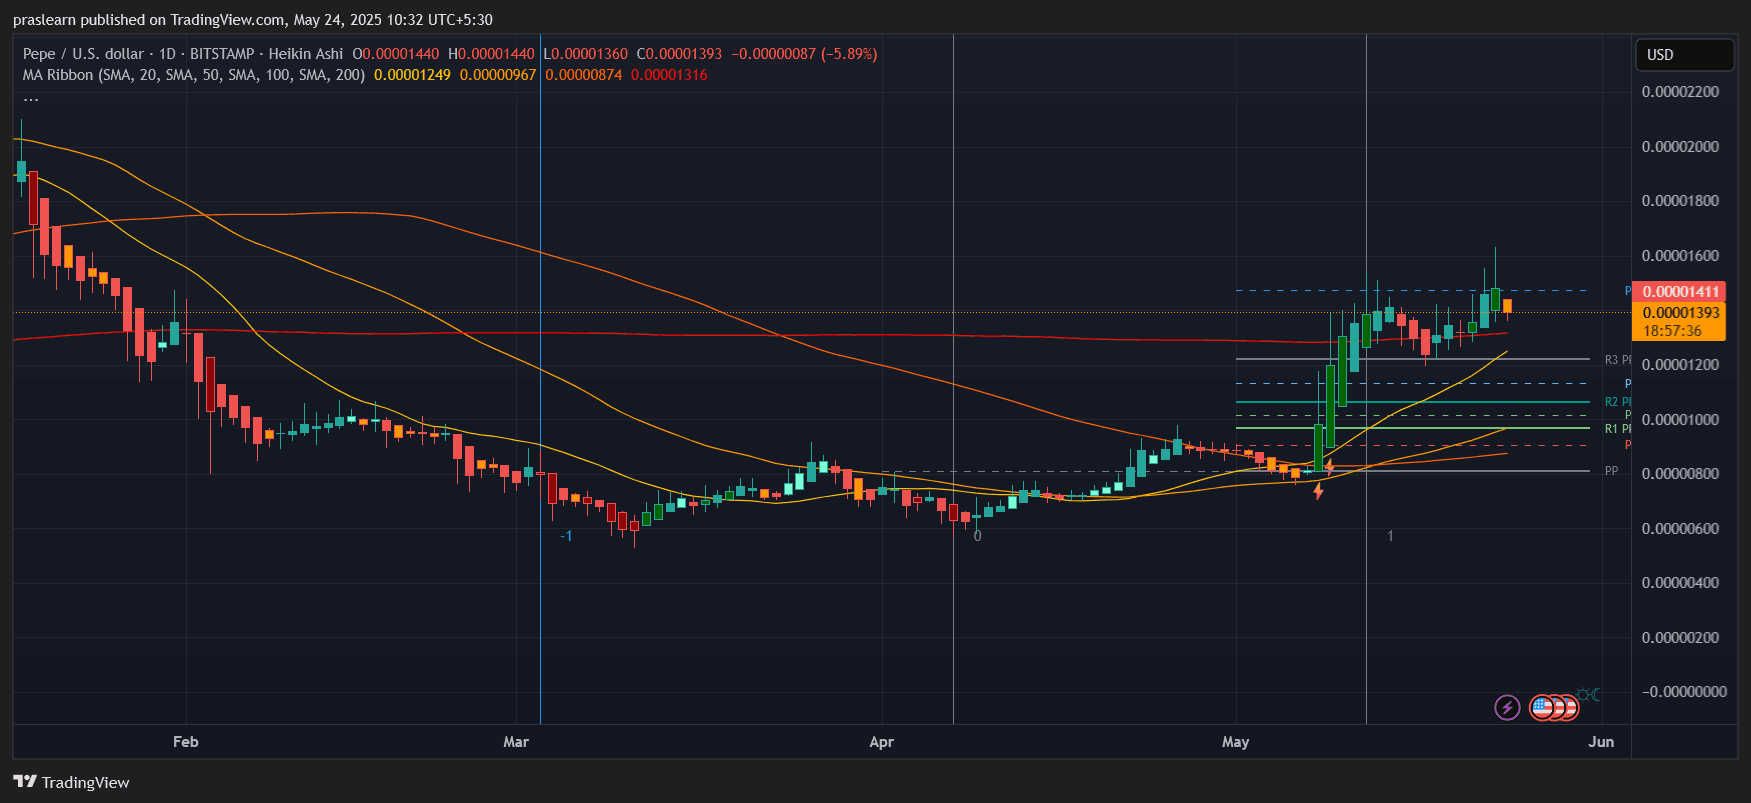
PEPE/USD Daily Chart- TradingView
Step back, way back, to the daily chart. See that tiny green shoot erupting from the soil of stagnation? That’s PEPE. Late April into early May, it didn’t just break free from its longterm downtrend; itexploded. Forget pennies; we’re talking fractions of fractions of a cent. From a humble$0.00000090it ripped through the atmosphere, soaring to over$0.00001600. The ascent? A mindboggling1666%+in under a month. This wasn’t a climb; it was a vertical launch.
Here’s a rough calculation:
(0.00001600−0.00000090/0.00000090) ×100≈1666.67%
That’s massive by any standard and such moves are often followed by cooldowns. That’s precisely what we’re witnessing now.
Currently, PEPE price is:
- Trading near thepivot point (P)level at$0.00001411.
- Holding above the 50-day moving average (around$0.00001249), which confirms a bullish mid-term trend. “* Rocketing past its 100 and 200-day Simple Moving Averages, the stock price leaves behind the dust of months spent clawing out of a bear’s grip.”
“Picture this: prices surge ahead, forging a bullish path, leaving the moving averages scrambling to keep pace. Then, a pause – a chance for the averages to catch their breath and align. This isn’t weakness; it’s the market flexing its muscles, a healthy consolidation fueling the next explosive leap.”
Support and Resistance Levels to Watch
From the chart structure and MA ribbon:
- Supportis seen at$0.00001350(hourly 200 SMA), and a stronger base at$0.00001249(daily 50 SMA).
- Immediate resistancelies at$0.00001473and then at the psychological zone around$0.00001600.
- Breaking above$0.00001600with volume would likely re-ignite the bullish sentiment and set sights on$0.00001800 to $0.00002000.
PEPE Price Prediction: Will PEPE Go Up Again?
PEPE teeters on the edge of a bullish surge! To ignite the rocket, it needs to smash through $0.00001473 and conquer the $0.00001500-$0.00001600 fortress. Only then can PEPE resume its glorious ascent.
Holding steady above $0.00001350 is the key. Watch for buyers to ignite a rocket toward the recent peak. Should momentum return, Fibonacci extensions hint at a tantalizing $0.00001820 target in the near future.
However, failure to hold$0.00001350could lead to a quick drop to$0.00001200, the next major demand zone.
Final Thoughts
Pepe’s price is catching its breath after a rocket-fueled ascent, now coiled tight in a classic consolidation pattern. Buoyed by all key daily moving averages, and with hourly support steadfast at $0.00001400, Pepe appears ready to pounce once again. Keep a close eye on this meme king; the next breakout could be epic.
If bulls defend $0.00001350 and flip $0.00001473 into support, PEPE could target $0.00001800 in the next leg up.
If support crumbles, brace for a swift pullback before the bulls regain control. Savvy traders will eye volume surges and moving average dances to validate the breakout’s authenticity.
Verdict: Accumulation phase likely watch for breakout above $0.00001500 for next bullish wave.
Thanks for reading PEPE Just Paused… Is the Next Meme Coin Rally Loading?

